This tutorial aims to explore the relationship between crime and socio-economic status using the latest available census data in England and Wales, United Kingdom using ArcGIS Pro 2.9.1. A future tutorial will demonstrate the use of CrimeStat III, a freely available spatial statistics program for the analysis of crime incident locations.
As a foreword to this tutorial, it should be noted that whilst crime and socio-economic status are often inextricably linked, a simple bivariate spatial analysis of the relationship does not explore the almost limitless number of variables that are related to the level or frequency of the incidence of crime observed. Remember: correlation does not equal causation.
Software used:
Data used:
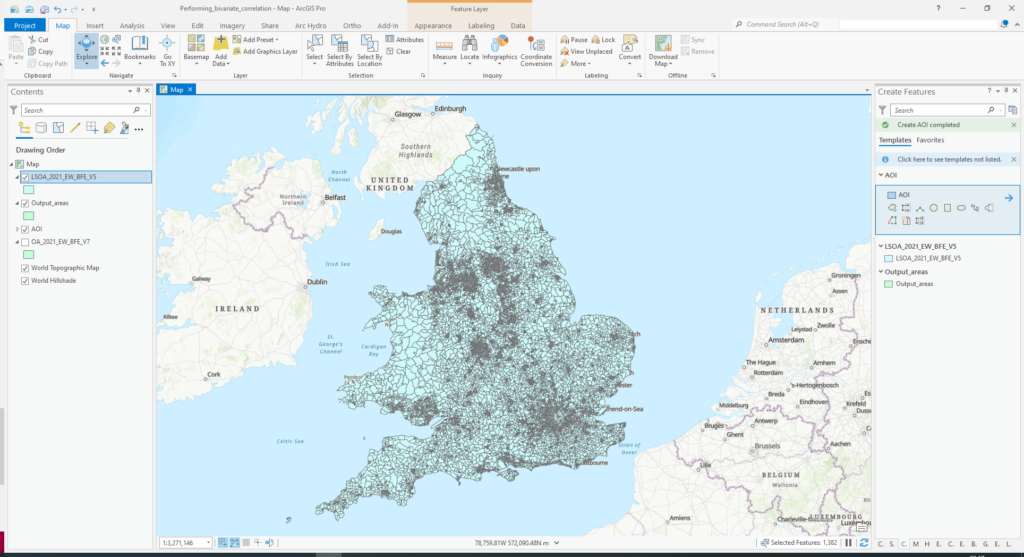
Create a new project in ArcGIS pro, giving it a suitable name and folder structure. Once created, download the Output Areas geodatabase and add the data to the ArcGIS Pro project using ‘Add Data’ on the Map ribbon. Once imported, your map should appear as below:
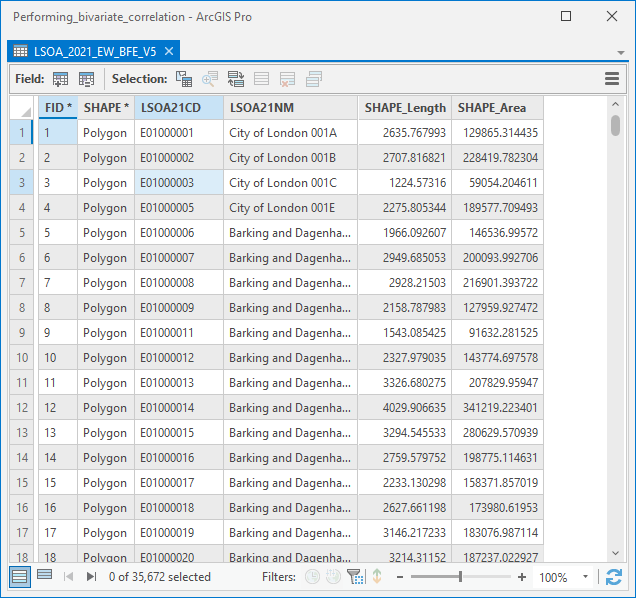
Open and inspect the attribute table of the data by right clicking on the layer in the contents pane and selecting ‘Attribute Table’. The attribute table contains each output area of England and Wales along with the shape properties such as length and area. Later in the turorial, the output area identified in the ‘OA21CD’ column will be utilised to join other data such as crime incidence data.
Next, let’s create a Polygon Map Notes layer that will be used to create the area of interest polygon that will be further used to extract the census output areas around Cambridge, United Kingdom.
On the Insert ribbon, within the Layer Templates panel, click the drop down and select Polygon Map Notes to insert a new empty layer. Once complete, left click on the layer in the contents pane and on the Edit ribbon, click create.
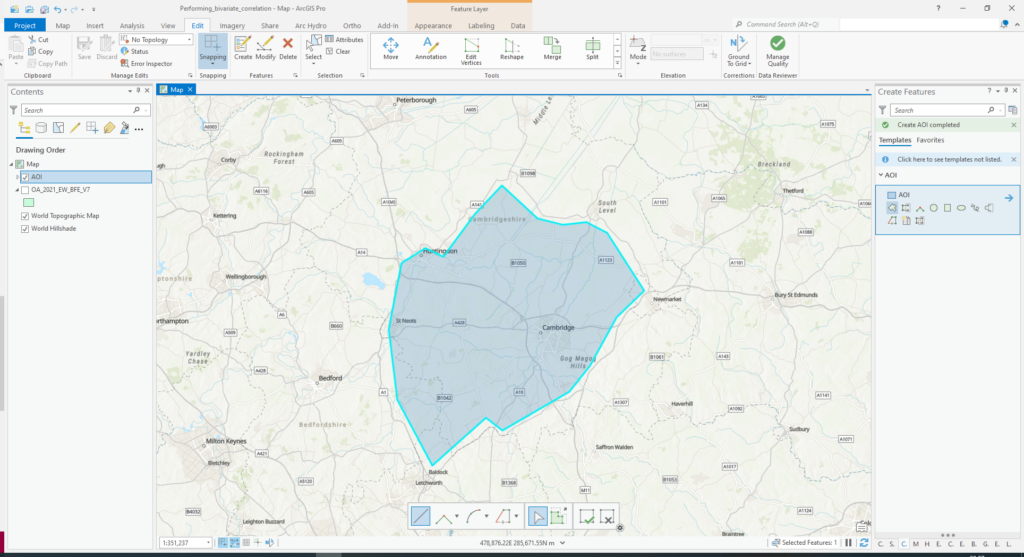
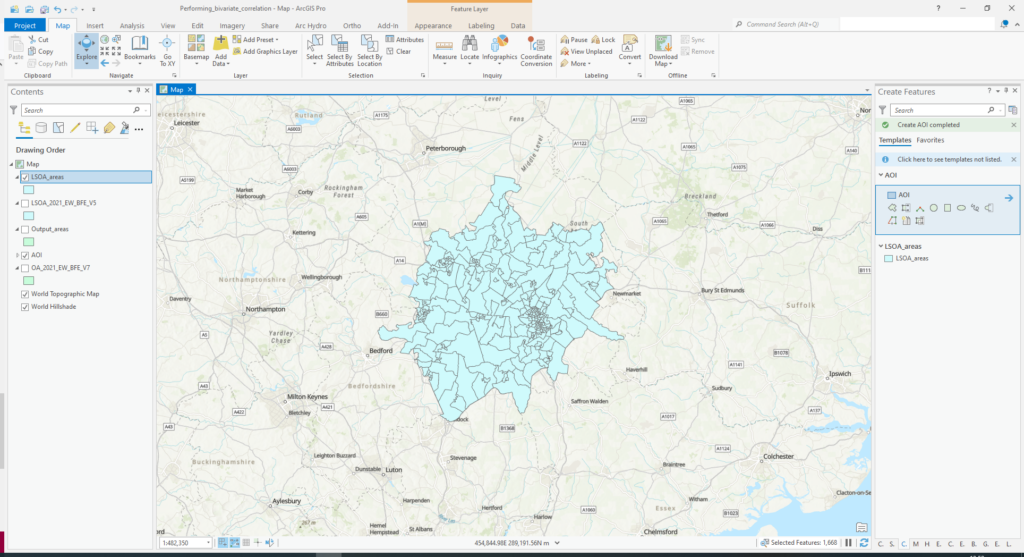
Create a polygon according to your area of interest. I have selected an area around Cambridge, United Kingdom, although you can select a different area of interest. An example of the area selected is shown in the screenshot below.
Now the AOI layer has been created, select the output areas in the ‘Oa_2021_EW_BFE_V7’ layer using the Select by Location tool on the Map ribbon.
Using the input features ‘OA_2021_EW_BFE_V7’, select the relationship Intersect and selecting features as AOI (the newly created Polygon Map Notes layer).
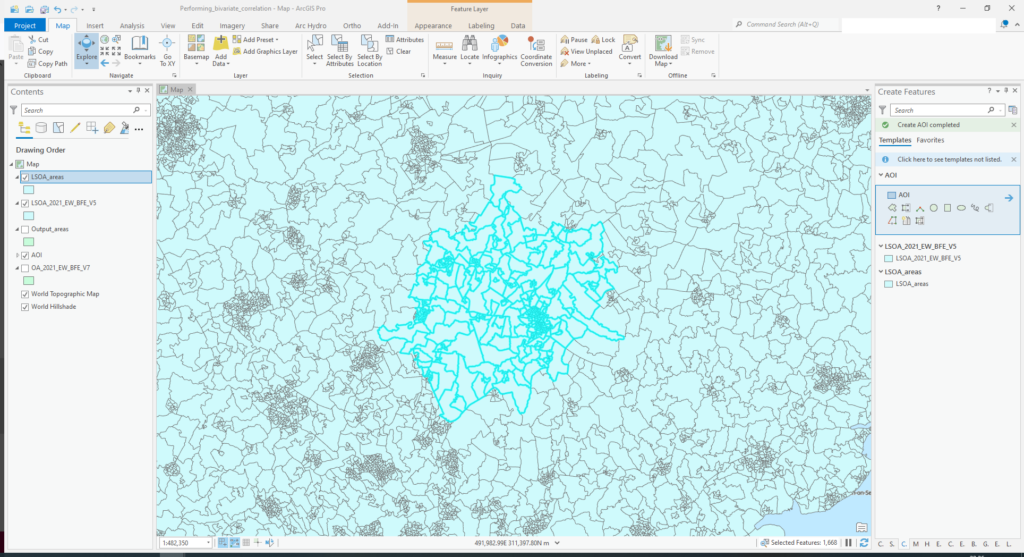
The results of the ‘Select by Location’ operation should appear similar to below.
With the features still selected, right click on the ‘OA_2021_EW_BFE_V7’ layer in the contents pane and select export features. Export the selected features to a new Shapefile named ‘Output_areas.shp’. Once complete, remove the ‘OA_2021_EW_BFE_V7’ layer from the contents pane. The new ‘Output_areas’ layer should appear as below.
| Cookie | Duration | Description |
|---|---|---|
| cookielawinfo-checkbox-analytics | 11 months | This cookie is set by GDPR Cookie Consent plugin. The cookie is used to store the user consent for the cookies in the category "Analytics". |
| cookielawinfo-checkbox-functional | 11 months | The cookie is set by GDPR cookie consent to record the user consent for the cookies in the category "Functional". |
| cookielawinfo-checkbox-necessary | 11 months | This cookie is set by GDPR Cookie Consent plugin. The cookies is used to store the user consent for the cookies in the category "Necessary". |
| cookielawinfo-checkbox-others | 11 months | This cookie is set by GDPR Cookie Consent plugin. The cookie is used to store the user consent for the cookies in the category "Other. |
| cookielawinfo-checkbox-performance | 11 months | This cookie is set by GDPR Cookie Consent plugin. The cookie is used to store the user consent for the cookies in the category "Performance". |
| viewed_cookie_policy | 11 months | The cookie is set by the GDPR Cookie Consent plugin and is used to store whether or not user has consented to the use of cookies. It does not store any personal data. |