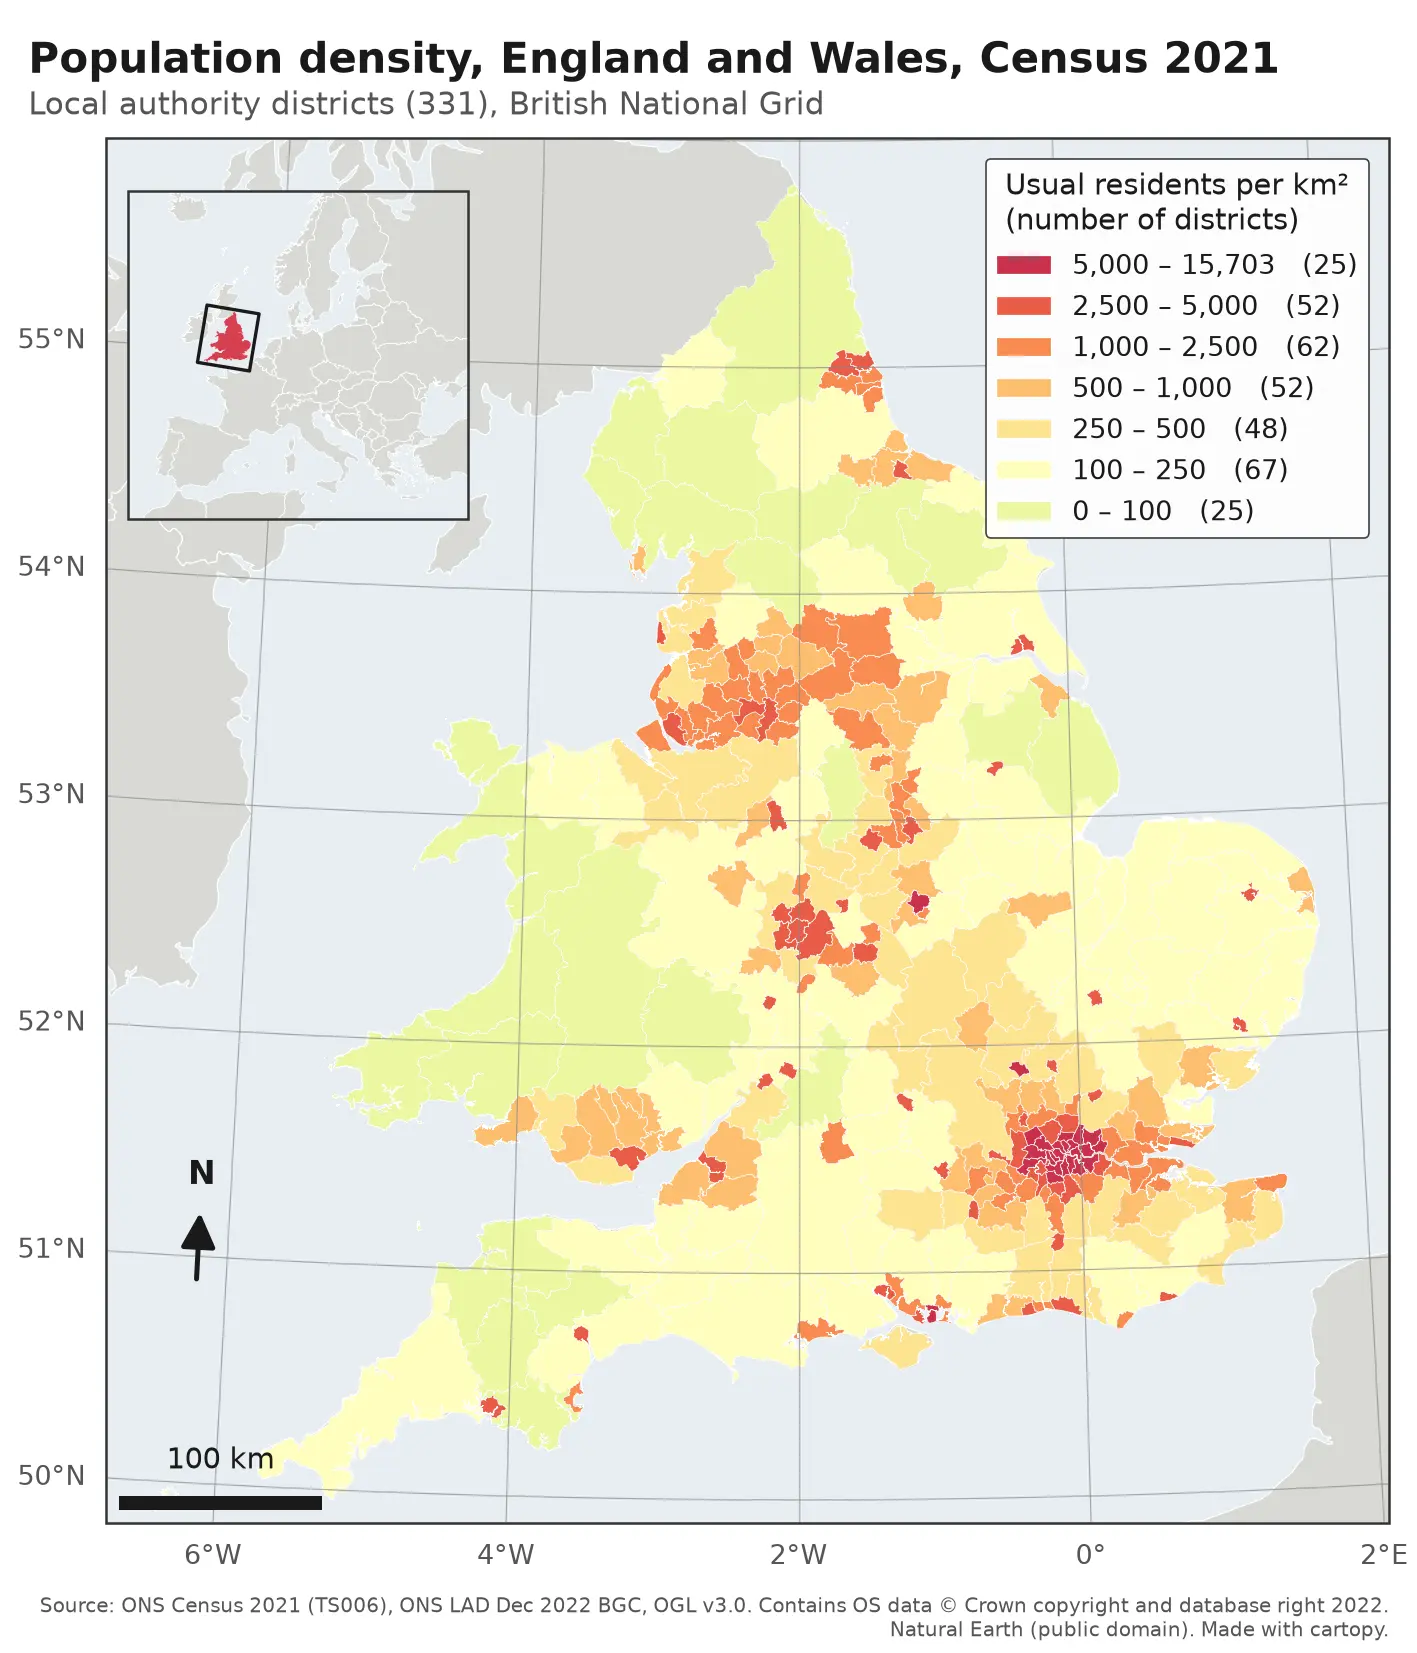
Make a map in Python with matplotlib and cartopy: projections, classified choropleths, scale bars, north arrows and inset maps
A cartopy tutorial for publication-quality maps in Python: choose a projection, draw a classified choropleth of Census 2021 population density with a proper legend, add a scale bar, a true-north arrow, an inset locator map and gridlines, style it for light and dark backgrounds, export at 300 dpi to PNG, PDF and SVG, and shade the Copernicus DEM for Greater Manchester.