Sentinel-1 SAR flood mapping in Python: the 2022 Pakistan floods
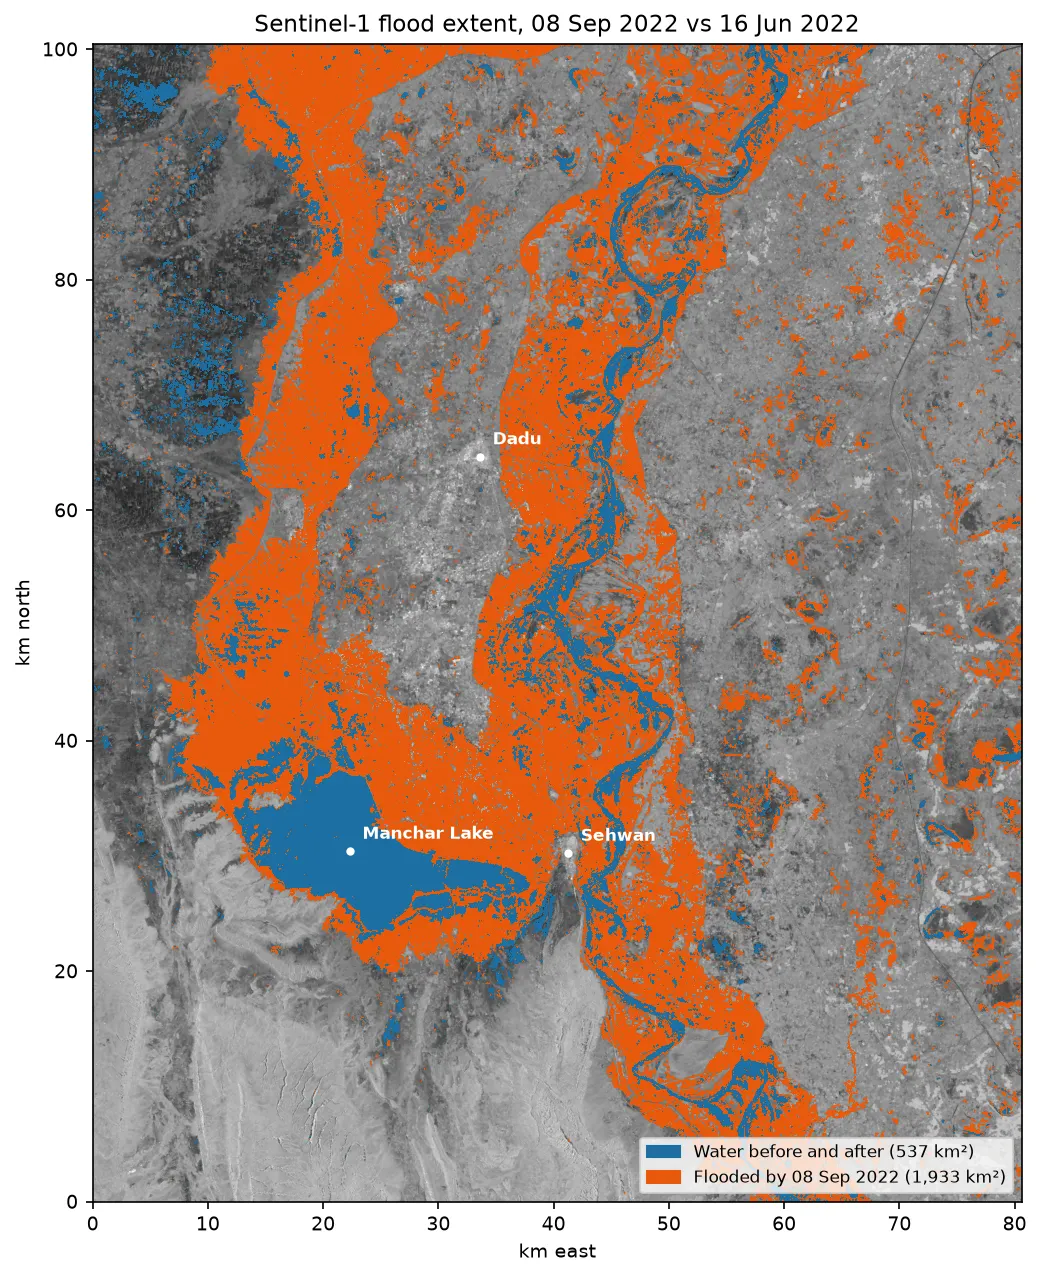
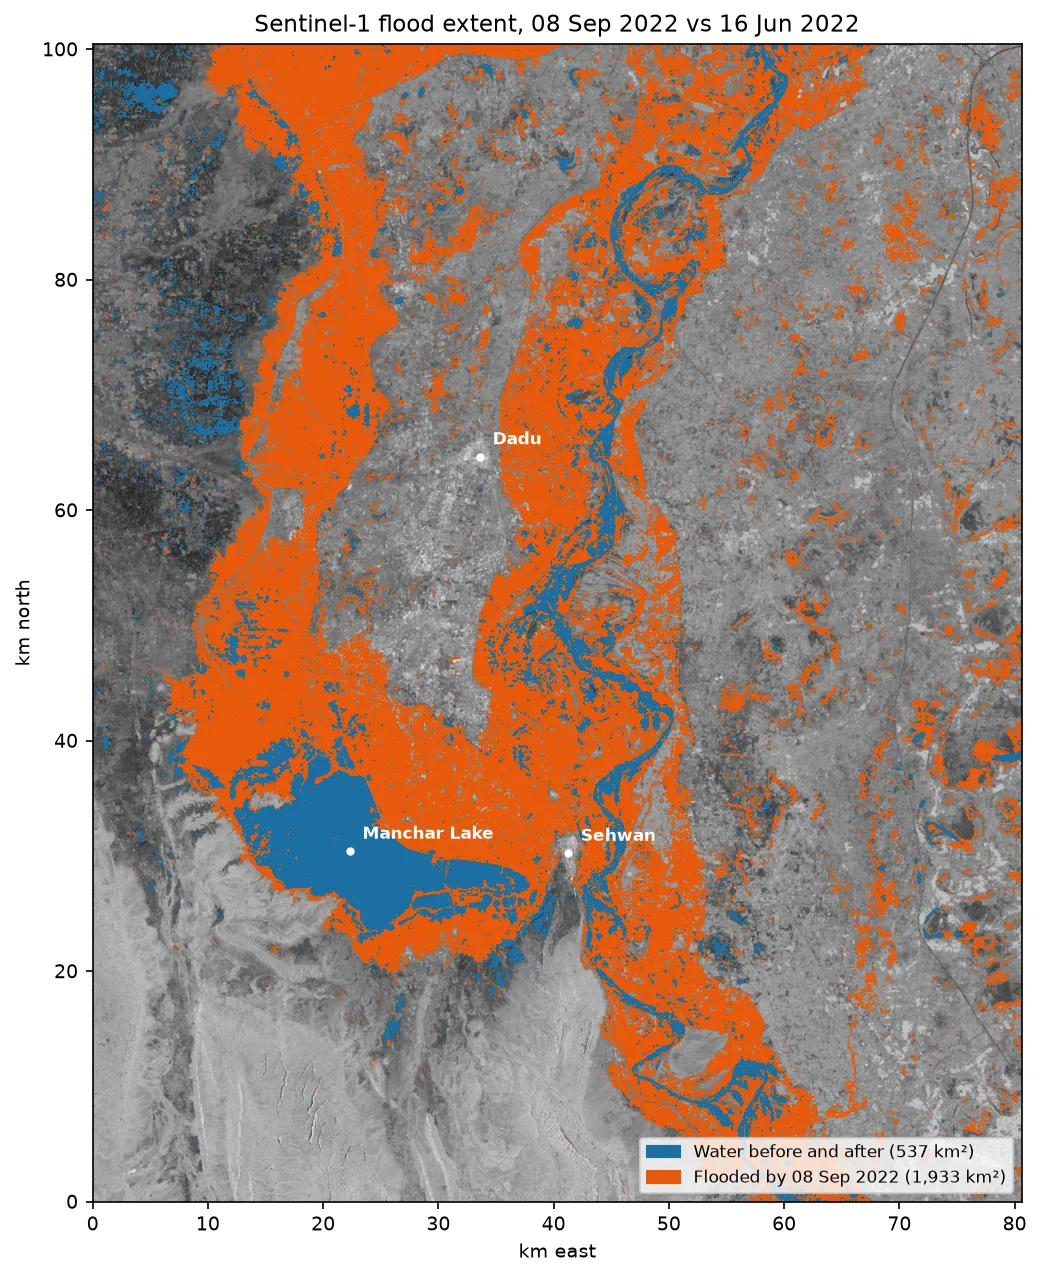
How much land did the 2022 Sindh floods cover, and how fast did the water recede?
- 1,933 km² newly flooded of 8,095 km²
- Otsu threshold −14.1 dB
- 332 km² still flooded on 25 Dec
Geospatial consulting for teams who need flood extents, terrain models, water-quality trends or automated GIS workflows, delivered with the Python code that produced every number.
UK-based, working remotely. A written scope before any work starts. You keep the code.
Repeatable GeoPandas, Shapely and rasterio workflows that replace manual clicking: spatial joins, overlays, format conversion and scheduled processing, with spatial indexes so they stay fast at scale.
Fast vector geoprocessing in Python: spatial indexes, overlays and modern file formatsSentinel-1 SAR flood mapping, Sentinel-2 water and vegetation indices, water-quality proxies and change detection, streamed from STAC catalogues so only the pixels you need are downloaded.
Sentinel-1 SAR flood mapping in Python: the 2022 Pakistan floodsPoint-cloud cleaning and classification, DTM, DSM and canopy height models, hillshade, slope, aspect, profiles and zonal statistics from national and global elevation data.
LiDAR point clouds in Python with laspy: from a LAZ file to a DTM, DSM and canopy height modelShareable Leaflet maps built from your GeoDataFrames: styled layers, tooltips, popups and switchable basemaps, delivered as a single HTML file or embedded in your site.
Interactive web maps from Python with Folium and GeoPandas .explore()Finding the right boundaries, elevation, imagery and statistics for a country or study area, checking licences and formats, and getting them into a usable, documented shape.
GIS data sources catalogueHands-on sessions for analysts moving from desktop GIS to Python, built around worked examples like the ones on this site and adapted to your own data.
Python geospatial tutorialsWatertight, print-ready STL models of real landscapes from a DEM, scaled to your print size and checked before they reach the printer.
From DEM to 3D-printable STL with Python and NumPyFour worked projects from this site. Each started with a question, used public data, and ends with figures you can reproduce from the published script.
How much land did the 2022 Sindh floods cover, and how fast did the water recede?
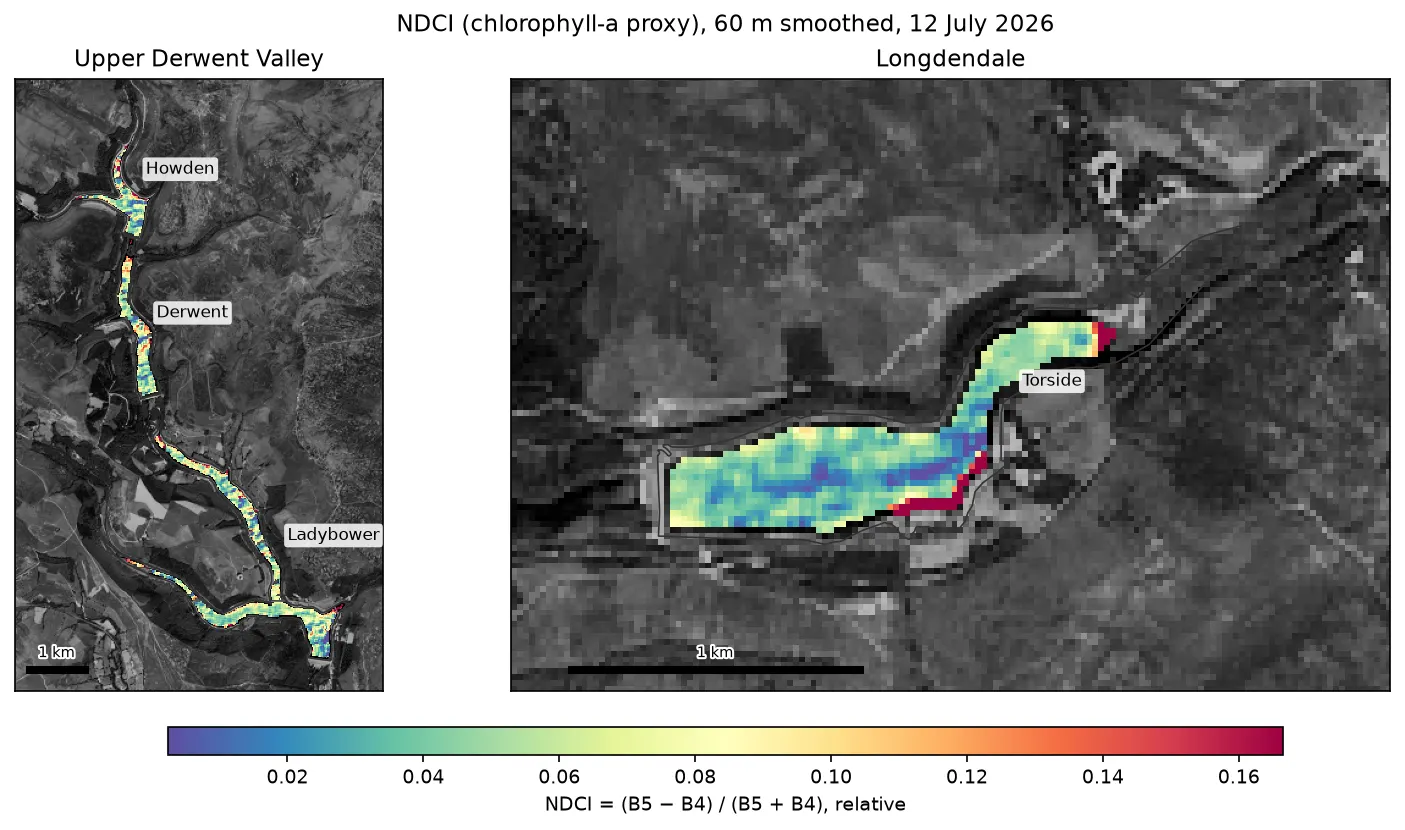
Can free imagery flag chlorophyll and turbidity changes in small upland reservoirs?
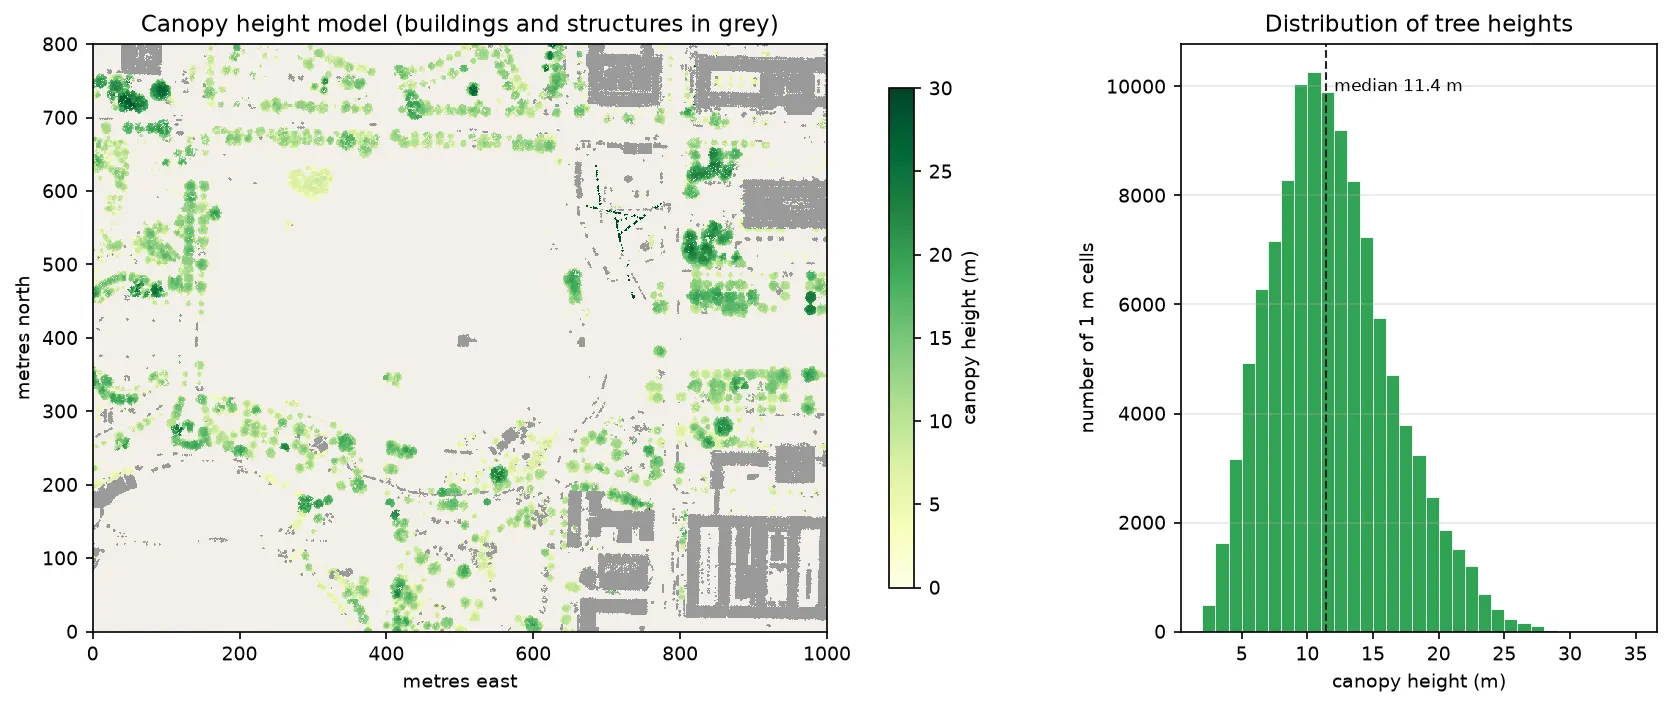
How tall are the trees on the National Mall, and how accurate is the surface model?
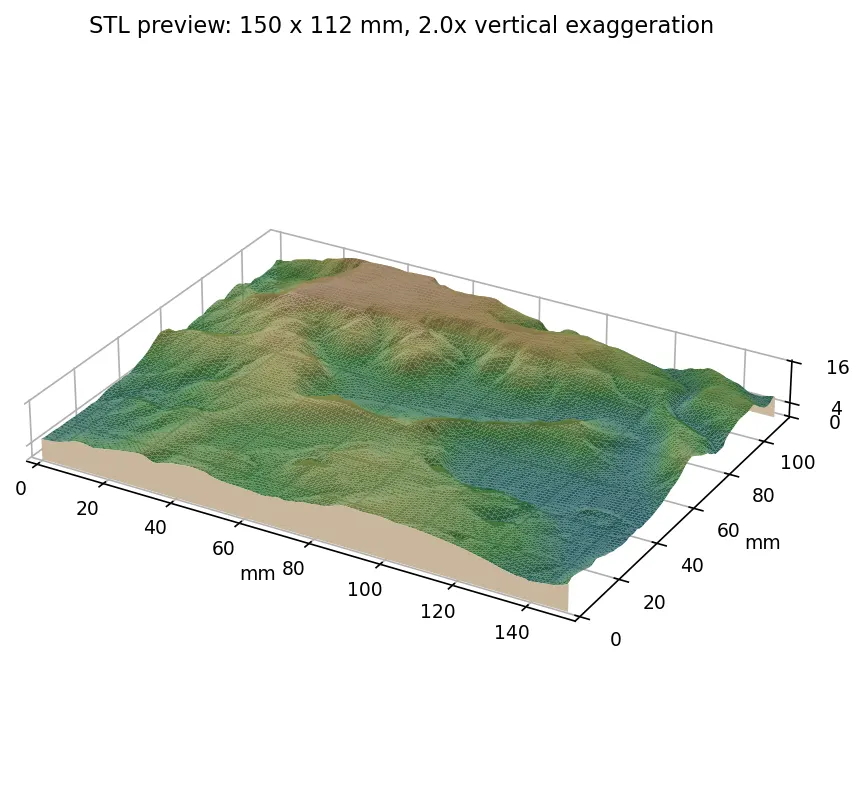
Can a free 30 m DEM become a physical model of the Edale valley?
The work is published in the open. There are 10 Python tutorials, 10 of them with their full scripts, requirements and recorded console output on a source code page. Each states the library versions it was tested with, and names every dataset and its licence.
The GIS data catalogue lists 880 sources for 237 countries and territories, link-checked automatically. It's the same groundwork that goes into sourcing data for a client project.
A conversation about the question you need answered, the data you have, and what a useful result looks like for you.
A written scope: the deliverables, the data and methods, what is out of scope, the timeline and a quote.
Work in agreed stages with early outputs to check against, so surprises in the data surface while there is still time to adjust.
Results, maps and the scripts that produced them, with notes on how to rerun them on new data. Nothing depends on us afterwards.
You do. Everything produced for your project, including the scripts, is handed over at the end, and your own data is used only for your project.
Mainly Python: GeoPandas, Shapely, rasterio, rioxarray, pystac-client, laspy, OSMnx and Folium, plus QGIS and ArcGIS Pro where a desktop GIS fits better. If your team already works in a particular stack, the work can fit around it.
By default, yes. Open libraries and free data such as Copernicus Sentinel, the Copernicus DEM, USGS 3DEP and OpenStreetMap keep costs down and mean you can rerun the work without licences. Commercial data or software can be used when a project needs it.
Yes. Confidentiality terms can be agreed before you share any data or details of the project.
TechnicalGIS is based in the UK and works remotely, so projects from clients elsewhere are welcome. The tutorials on this site were produced the same way, from public data and cloud-hosted archives.
Each project is scoped individually, so there is no price list. After a short discovery call you receive a written proposal with a quote before any work starts.
Describe the question, the area and any data you already have. You'll get a reply by email and, if it's a good fit, an invitation to a discovery call.
Start a consulting enquiry