#Zarr

2 posts

Tutorial Python

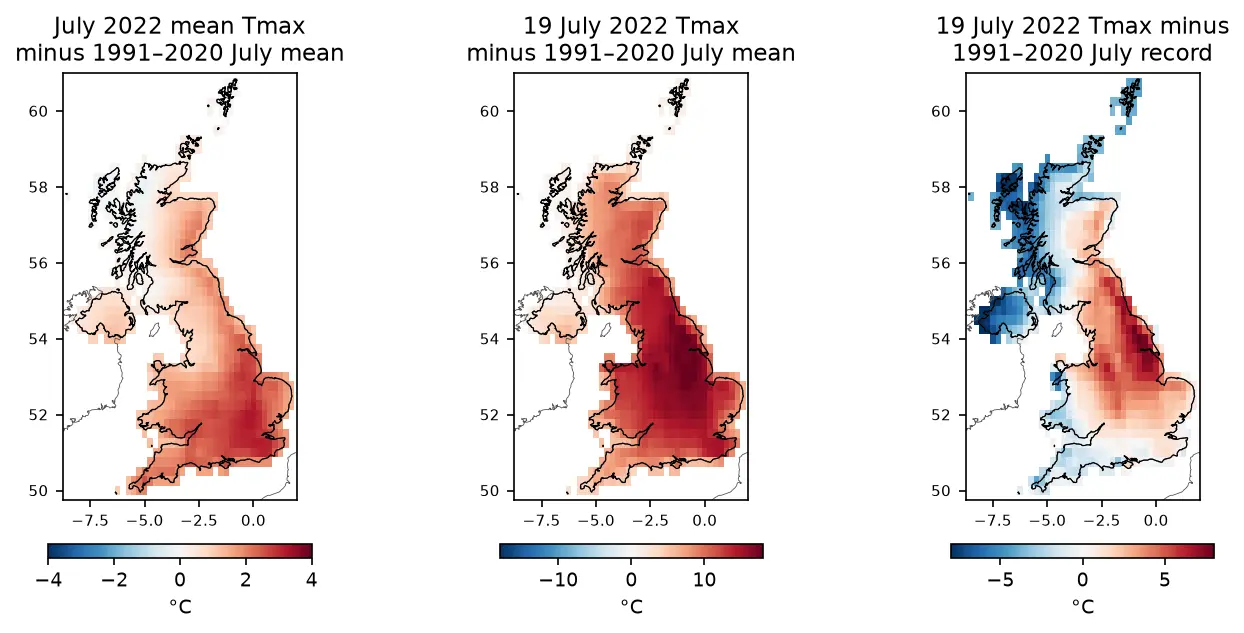
ERA5 in Python with xarray: mapping the July 2022 UK heatwave

Read ERA5 climate reanalysis in Python with xarray from free, login-free cloud Zarr stores, clip it to the UK, compute area-weighted means and anomalies against 1991–2020, export a Cloud Optimised GeoTIFF and check it against Met Office stations.
Intermediate 13 min read

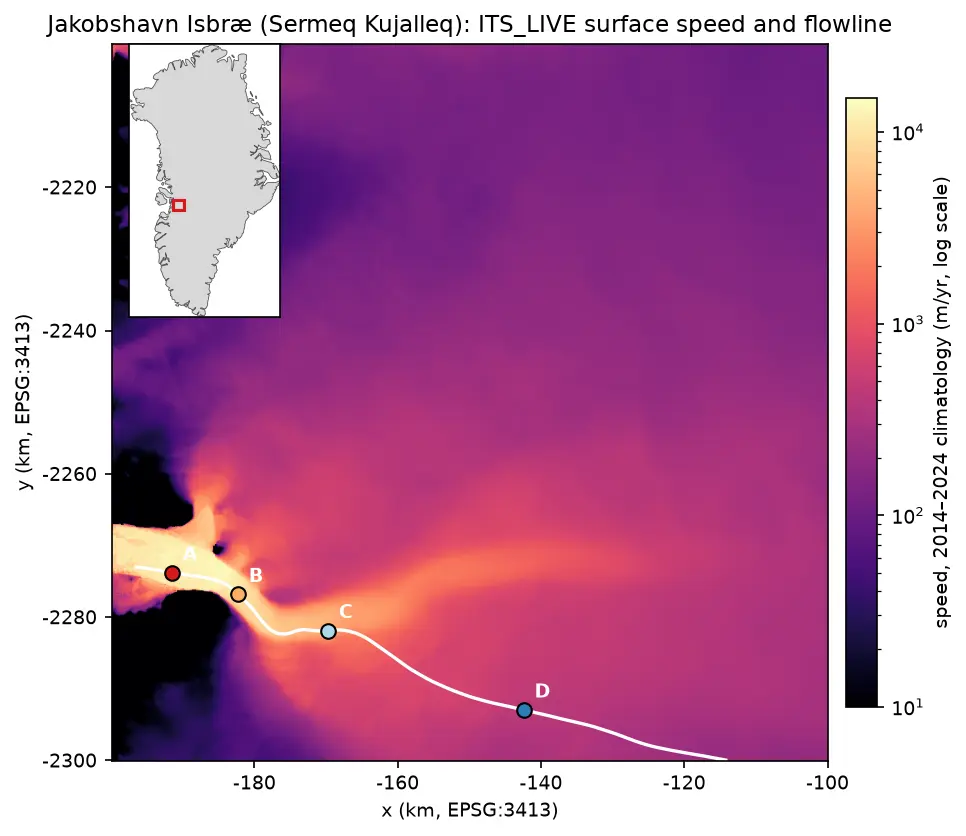
Map of ITS_LIVE surface speed around Jakobshavn Isbræ on a logarithmic colour scale: a narrow channel of ice faster than 10 km per year runs west into the fjord, fed by a broad fan of slower ice from the ice sheet. A white flowline runs up the trunk with points A to D marked at 5, 15, 30 and 60 km, and an inset shows the location on the west coast of Greenland.

Tutorial Python

Glacier velocity in Python with NASA ITS_LIVE: Jakobshavn Isbræ, 1985–2025

Map glacier velocity in Python with NASA's ITS_LIVE Zarr datacubes on AWS, with no login: velocity maps, a flowline traced from the velocity field, 40 years of speed profiles, seasonal and multi-year time series from 80,568 filtered image pairs, and strain rates and flow directions on Jakobshavn Isbræ (Sermeq Kujalleq), Greenland's fastest glacier.

Advanced 15 min read