Climate time-series tools: charts and time-lapses for any place
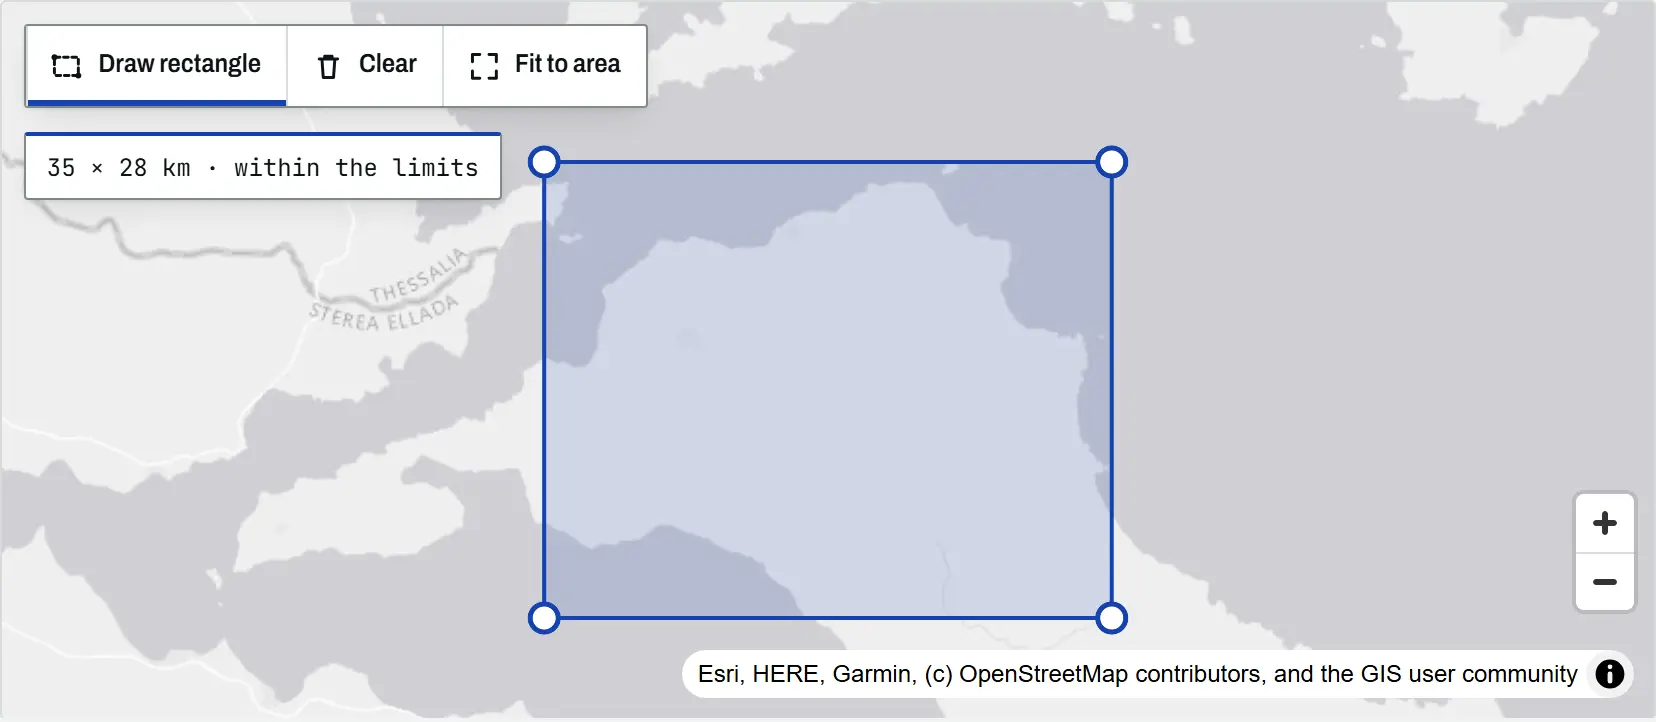
An introduction to the TechnicalGIS climate time-series tools: five open datasets, how to draw an area on the map, worked examples from London, north Evia, Nairobi and Las Vegas, the processing limits and the terms for reusing every output.