Pasture, water points, fires, floods and rainfall insurance: five more free tools
Five new free tools for herders, district offices and cooperatives: a pasture and water bulletin, a water point check, a weekly fire count, flood water near a village today and a rainfall insurance check. Real answers from Kenya and South Sudan.
Key takeaways
- Five new free tools: a pasture and water bulletin for a district, a check on any water point, a weekly fire count, flood water near a place today, and a test of whether a district rainfall index matches a farm's own droughts.
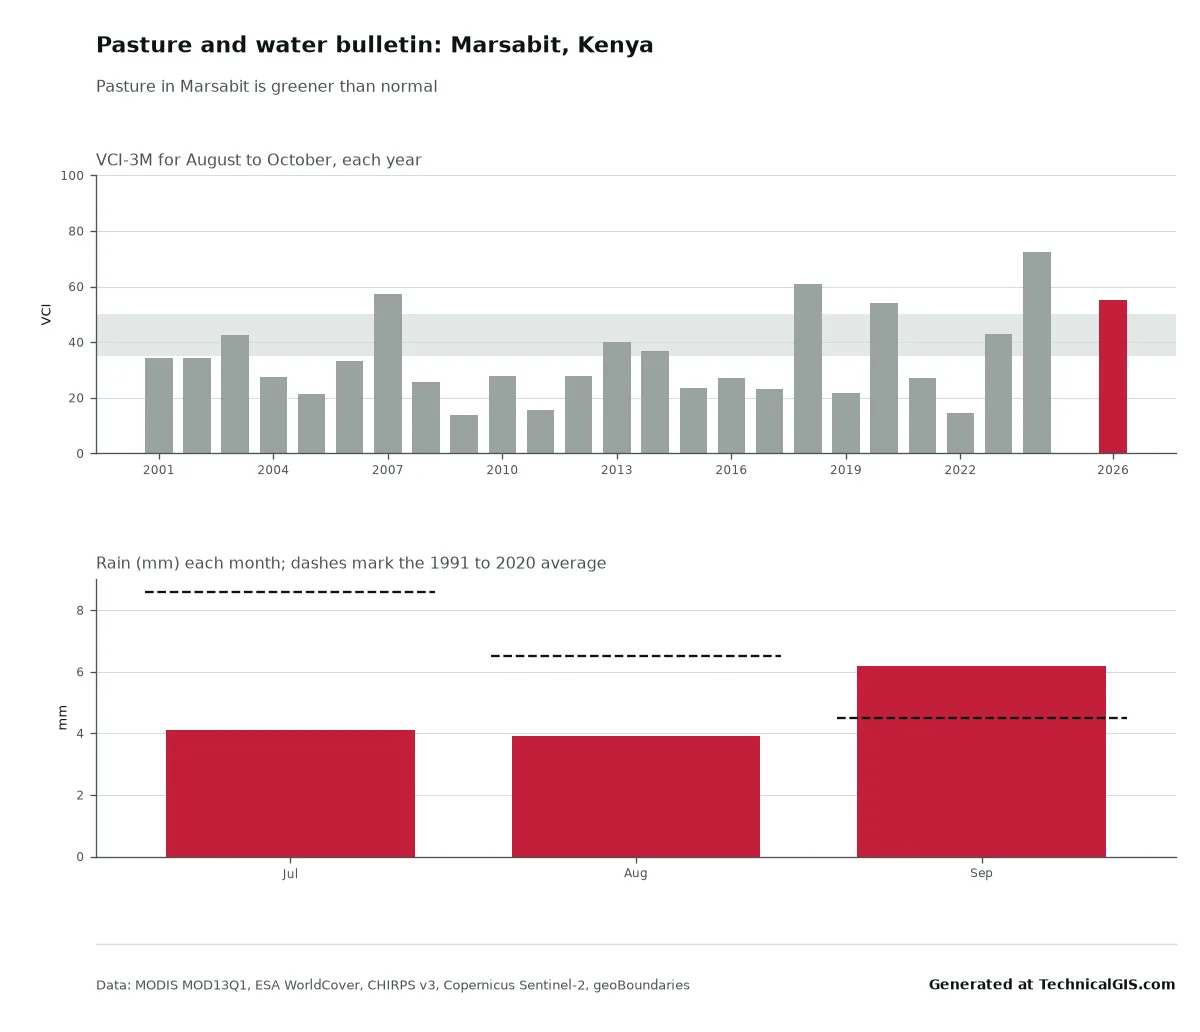
- Pasture in Marsabit, Kenya, was greener than normal from August to October 2026 (VCI 55), better than in 21 of the last 24 years, even though rain over the three months to September was 72% of normal.
- Aweil North in South Sudan had 112 satellite fire detections from 24 to 30 October 2026, against a usual 35 for that week and more than in any of the last ten years.
- A Kitui County rainfall index would have paid out in 5 of the 7 worst October to December seasons at Mwingi since 1991, but missed 1999 and 2007.
- Every answer comes with a one-page bulletin, a short text for SMS or WhatsApp, a spreadsheet and the data credits.
Before building anything new we asked a simple question: which local questions do people working with herders, farmers and district offices still struggle to answer, where satellite data can give a straight answer? The answers kept coming back to the same few things. Is the grazing holding up? Is there still water at the pan? Is this fire season out of the ordinary? Is there flood water near the village now? And would a rainfall insurance scheme actually pay out in the years that matter?
So there are five new community tools, each built around one of those questions. Like the season and flood tools, they’re free, work on a phone, and send back a plain answer rather than a dataset. Every answer comes with a one-page bulletin to print or pin up, a short text of 300 characters or less to forward by SMS or WhatsApp, the figures as a spreadsheet, a one-line reliability rating and the data credits.
Here’s what each one does, with a real answer for a real place.
Pasture and water: Marsabit, Kenya
The pasture and water bulletin is for county and district officers, NGOs and herder groups. It follows the method Kenya’s National Drought Management Authority uses in its monthly bulletins: the Vegetation Condition Index (VCI), which compares how green the grazing is with the same months in every year since 2001, averaged over three months and read against the same drought bands.
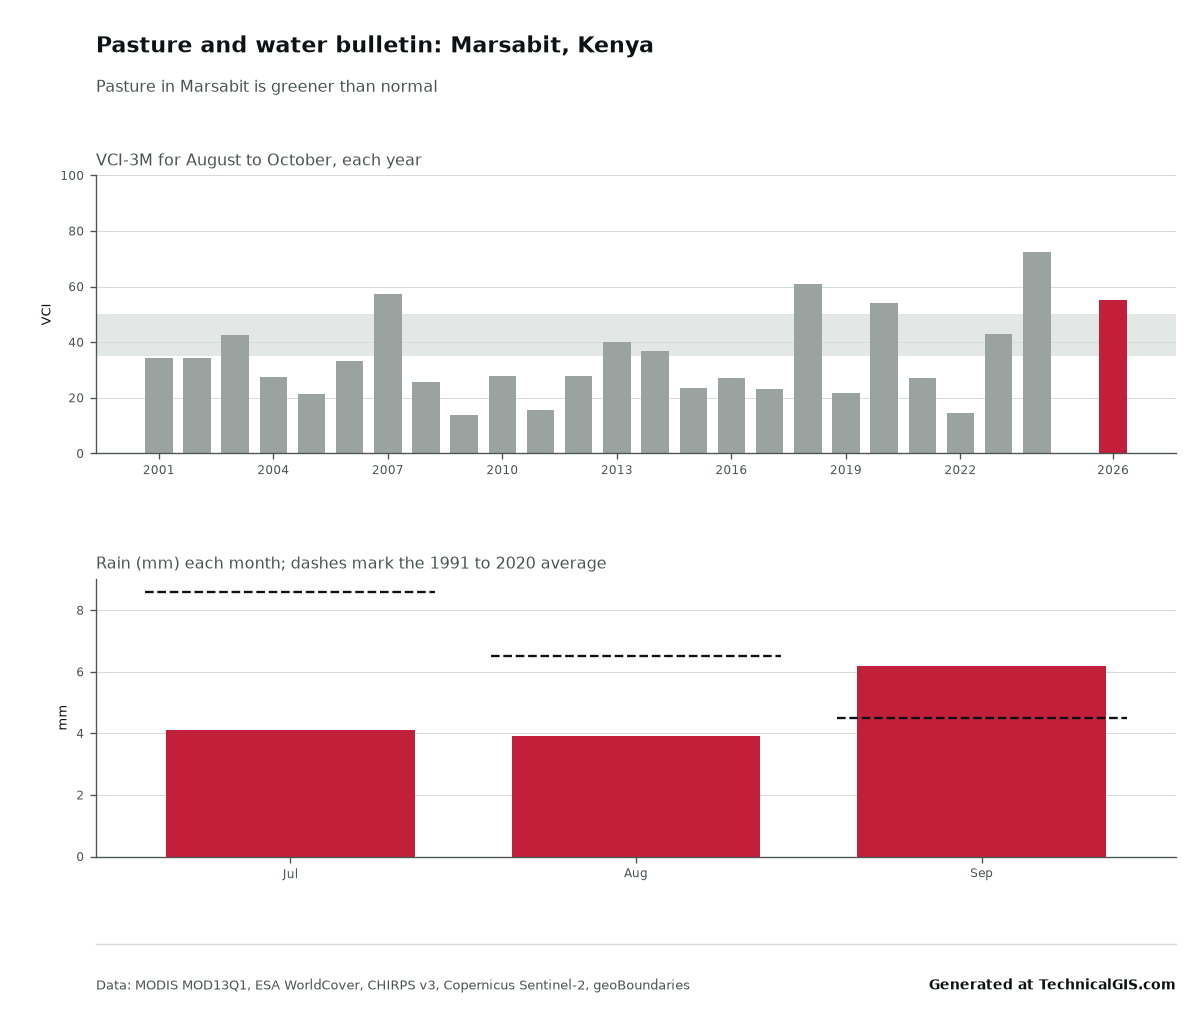
For Marsabit in late October 2026 the answer was clear: pasture is greener than normal, with a three-month VCI of 55, up from 49 the month before. Only three of the last 24 years were greener at this time of year. That’s despite rain over the three months to September being 72% of normal, 14 mm against a usual 20 mm. In the driest part of the year a few millimetres either way make little difference; what matters is that the long rains earlier in the year left good cover behind.
The same chart shows why the method is trusted. In 2022, at the height of the drought that killed an estimated 2.6 million livestock in Kenya (Kenya Drought Response Plan 2023), Marsabit’s figure for these months was 15: in the band NDMA calls severe drought.
You can add up to three named water points, and the bulletin reports whether each one still holds open water in the latest clear Sentinel-2 image. For warnings and official decisions, the bulletin points to NDMA, FEWS NET and, for locusts, FAO’s Desert Locust Watch. We don’t forecast locusts ourselves: FAO does it properly, and its bulletins are the ones to follow.
Download the Marsabit bulletin or the figures as CSV.
A water point: Lake Kamnarok, Baringo
The water point check answers one question for any pan, dam, pond or small lake: is there still water, and how does that compare with other years? Mark the place, choose how far around it to look, and the tool measures the open water in every clear Sentinel-2 image since 2017.
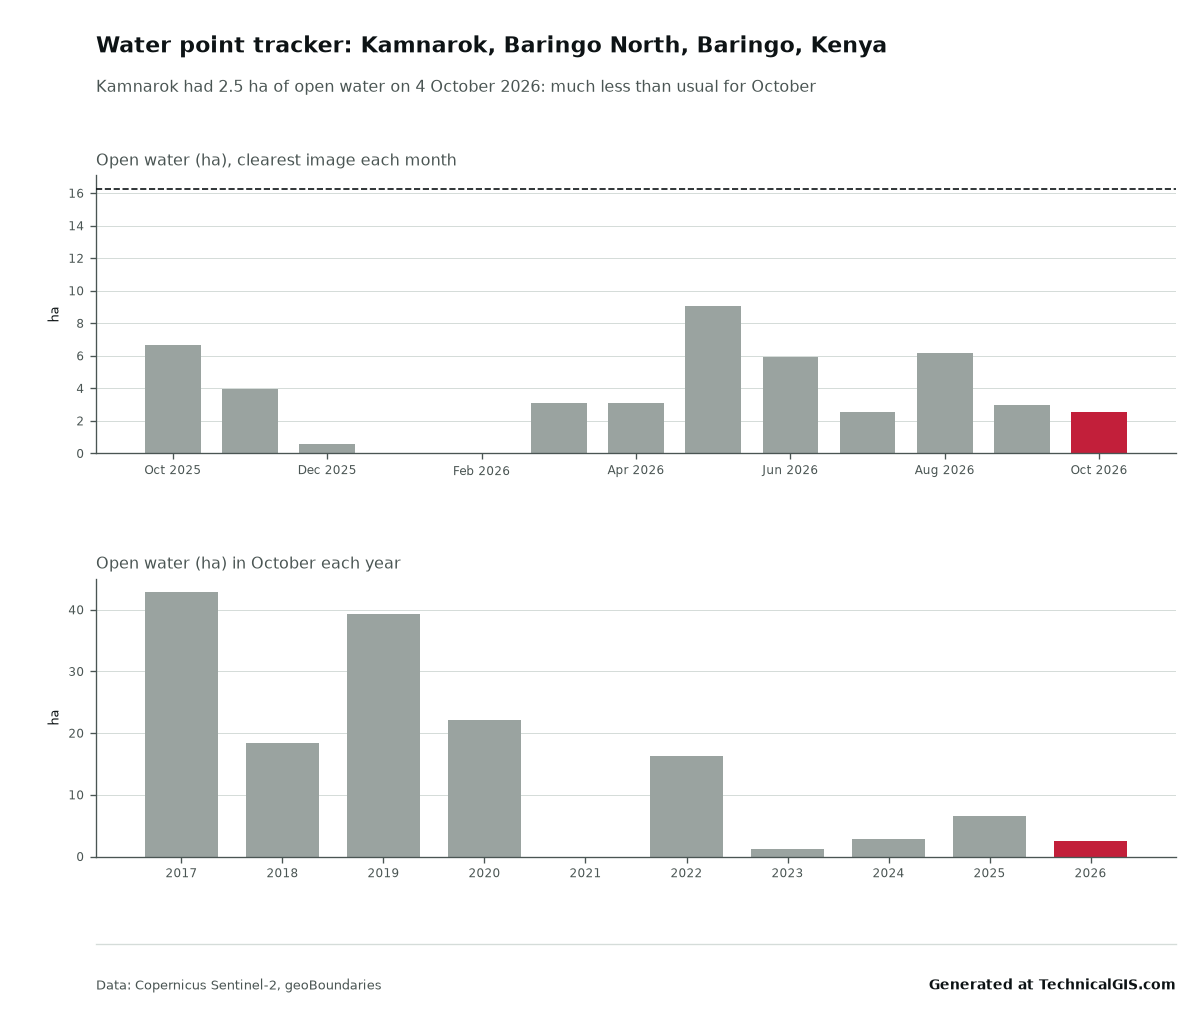
Lake Kamnarok sits in the Kerio Valley in Baringo County. On 4 October 2026 it held about 2.5 hectares of open water, 15% of what it usually has in October and down from 3 hectares a week earlier. In August 2019 the same check found 63 hectares. A field officer can send that out in one line: “Kamnarok, 4 October: 2.5 ha of water. 15% of usual for October. Shrinking.”
Download the Kamnarok answer or the CSV.
Fires this week: Aweil North, South Sudan
The fire digest counts the fires NASA’s satellites detected in a district over the last seven days, and sets that against the same week in each of the last ten years. It uses NASA’s FIRMS active fire records from the MODIS sensors, which go back far enough for a fair comparison.
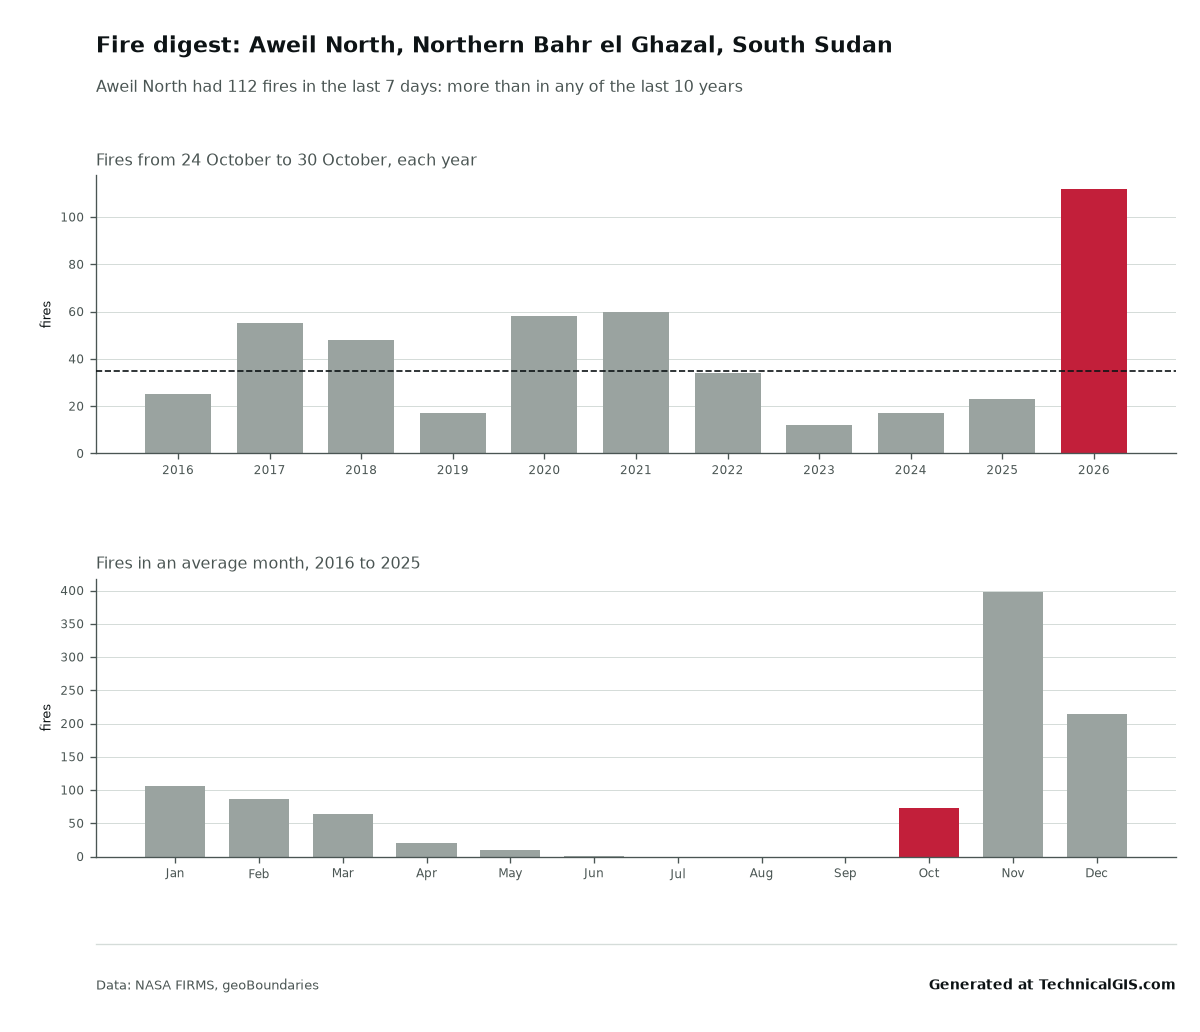
Aweil North had 112 fires from 24 to 30 October 2026. The usual figure for that week is 35, and the busiest of the last ten years had 60. Last year it was 23. The monthly chart puts that in context: fires here climb sharply in November, when an average month sees nearly 400 detections, so this year’s burning season has started early and hard. For a district office that’s a prompt to check on grazing land, crops waiting to be harvested and villages near the bush.
Download the Aweil North digest or the CSV.
Rainfall insurance: Mwingi, Kitui
Index insurance pays out when a measured figure, often district rainfall, falls below a trigger. It’s cheap to run because nobody has to visit each farm. The catch is basis risk: the index and the farm don’t always agree. The insurance basis-risk check is for cooperatives, micro-insurers and the people advising them, and shows how often a district rainfall index matched one place’s own bad years.
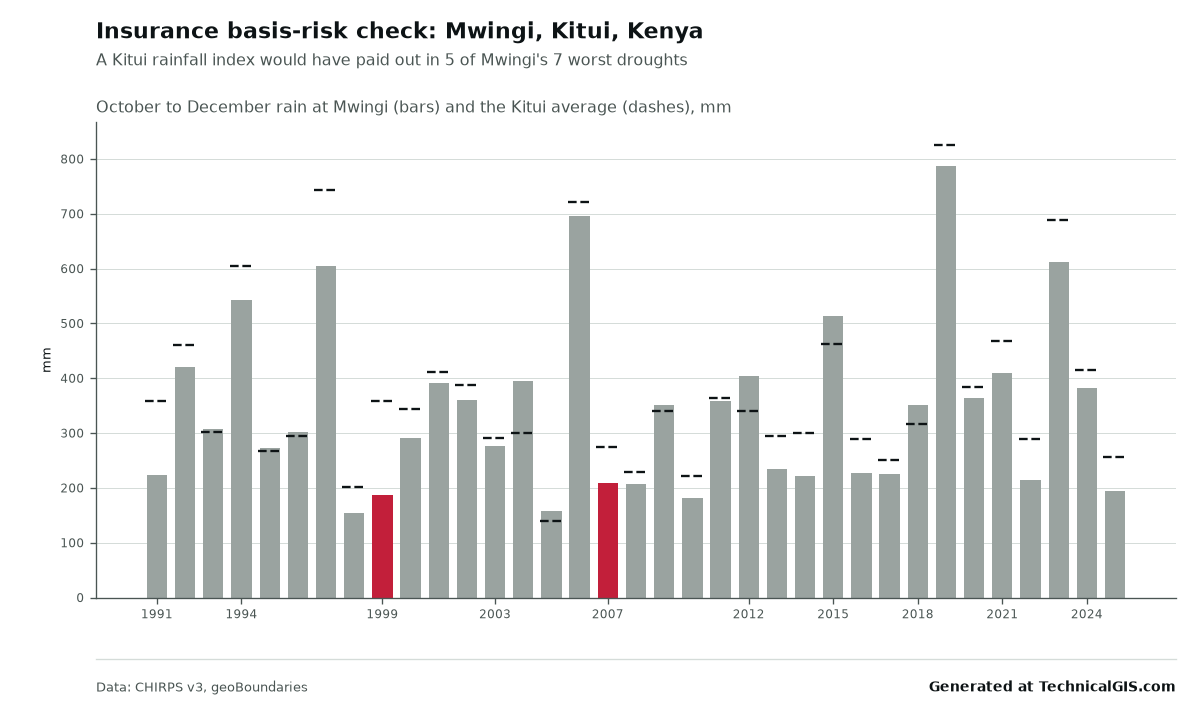
We tested a Kitui County index for the October to December short rains, paying out in the driest one year in five, against rain at Mwingi. Over 35 seasons, the index would have paid in 5 of Mwingi’s 7 worst. It missed 1999, when Mwingi had 188 mm but the county average was a near-normal 359 mm, and 2007. It also paid out twice, in 1995 and 2017, when Mwingi itself was fine. The two series move together closely (a correlation of 0.94), and still two droughts in seven slipped through. That’s the conversation worth having before anyone signs up. The Index Insurance Forum has good guidance on designing around it.
Download the Mwingi check or the CSV.
Flood water now: Bor, South Sudan
The original flood impact tool maps a past flood across a whole district. The new flood now tool is quicker and closer: mark a village or farm and it checks the latest Sentinel-1 radar image within 5 km for flood water, the land it covers and how many people live on it. Radar sees through cloud, so it works in the middle of the rains.
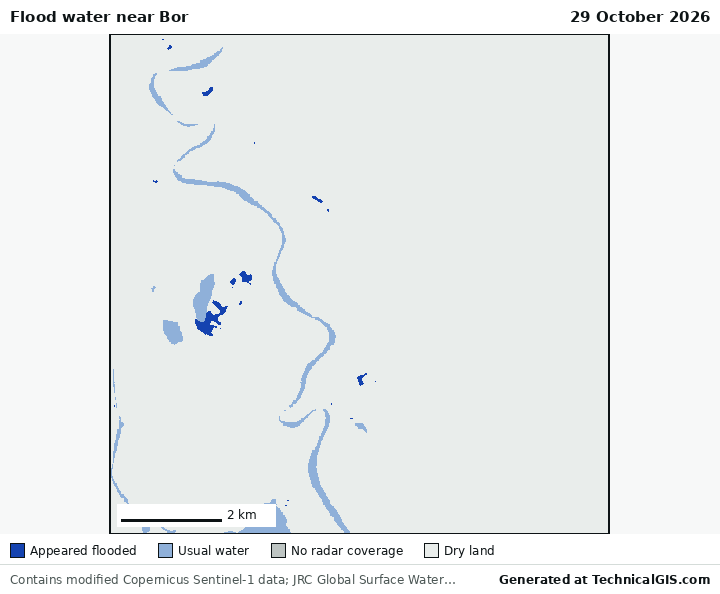
Bor, on the White Nile in Jonglei, has been flooded badly in recent years. On 29 October 2026 the radar showed only a few small patches of flood water near the town, about 0.3 km², home to around 20 people. For where the river is heading next, the answer links to GloFAS, the Copernicus river flood forecasts.
Download the Bor answer or the CSV.
Two more things for farmers
Farm check now has a fifth answer: “Does your maize need water?”, or whichever crop you grow. Choose maize, sorghum, millet, beans, groundnuts or cowpeas, and it works out how much water the crop needs at its stage of growth, how much rain it has had, and whether to water in the next 10 days. It follows the FAO-56 method, the standard reference for crop water use. For maize at Mwingi, sown at the usual start of the short rains, it says the crop needs about 545 mm over the season and a usual season brings about 335 mm the plants can use: some 210 mm short, so plan for watering or a quicker variety.
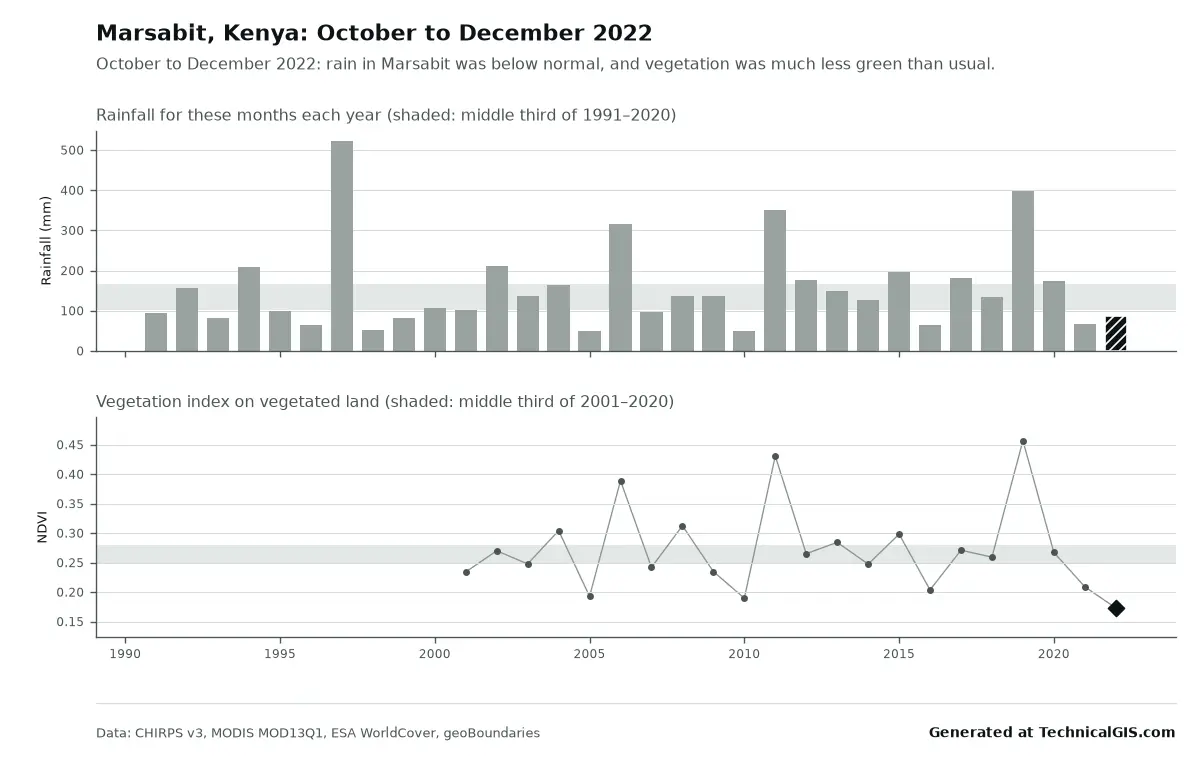
And the season condition answer now says where this season ranks. October to December 2022 in Marsabit brought 86 mm, 54% of usual: the 9th driest of 32 seasons since 1991, with the land the least green for those months since 2001.
Using them
All of the tools are free, with up to 15 new questions a day for each visitor; answers we’ve already worked out come back straight away and don’t count. Each answer has its own link and is kept for 90 days. Keep the line “Generated at TechnicalGIS.com” and the data credits, and you’re welcome to use it in reports, at meetings and on notice boards.
If you need a whole region every month, or a question these tools don’t answer, tell us about your project.
Key terms
- VCI
- Vegetation Condition Index: how green the land is compared with the same month in every year on record, from 0 (the worst) to 100 (the best). Kenya's National Drought Management Authority uses the three-month average in its drought bulletins.
- Basis risk
- The chance that an insurance index and a farmer's own losses disagree: the farm has a drought but the index doesn't pay, or the index pays when the farm was fine.
- MNDWI
- Modified Normalised Difference Water Index, a band ratio from Sentinel-2 that picks out open water. Water scores high; soil and plants score low.
Data for this article
- CHIRPS rainfall · Rainfall from 1981, about 5 km
- NASA FIRMS · Active fire detections from MODIS
- Microsoft Planetary Computer · Where we read MODIS, Sentinel-1 and Sentinel-2
- JRC Global Surface Water · Usual river and lake water, left out of flood maps
- Global Human Settlement Layer · Where people live
- geoBoundaries · District boundaries
Licences and formats for each source are listed in the GIS data sources catalogue.