Rainfall against the normal in Nairobi, 2016 to 2025
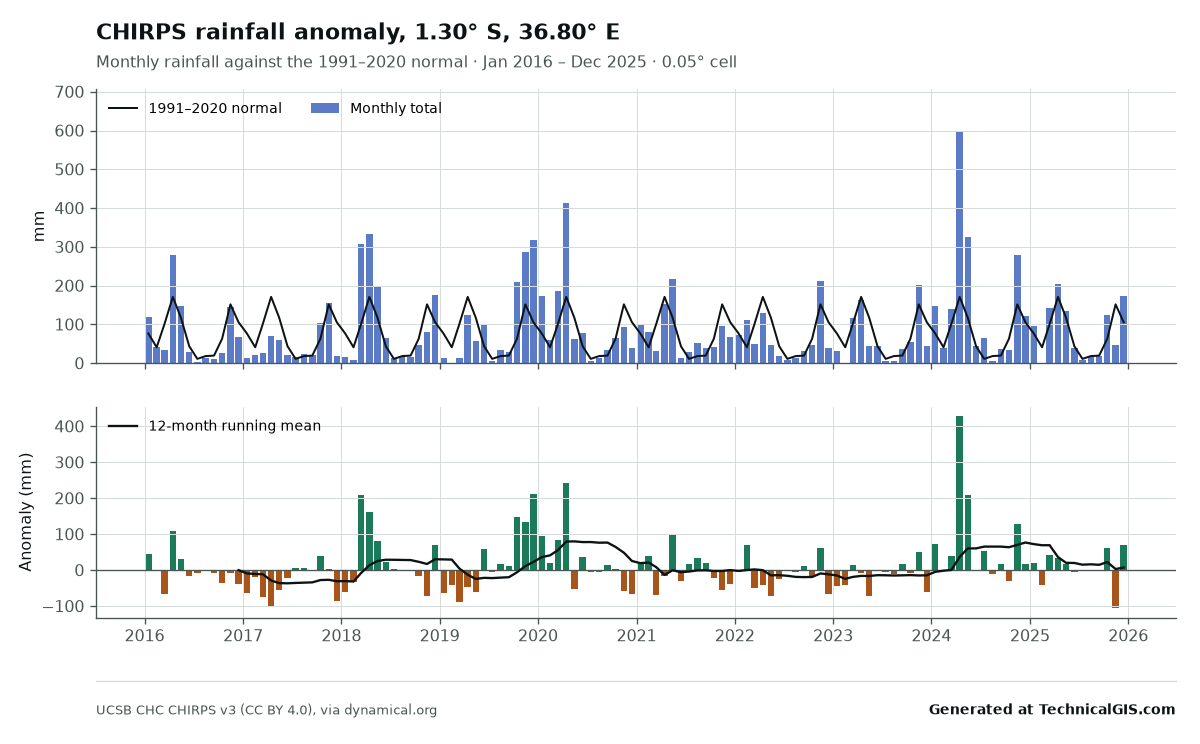
CHIRPS monthly rainfall for Nairobi compared with the 1991 to 2020 normal, highlighting the failed and exceptional rainy seasons.
About this output
Monthly rainfall for the CHIRPS 0.05° cell containing central Nairobi, January 2016 to December 2025, with the 1991 to 2020 monthly normal and the anomaly in millimetres. The consecutive below-normal rainy seasons of 2020 to 2022 and the very wet late-2023 short rains stand out.
Credit and reuse
You may reuse this output, including commercially, provided the line "Generated at TechnicalGIS.com" and the following credit are kept with it:
UCSB Climate Hazards Center CHIRPS version 3.0 data processed by dynamical.org from the Climate Hazards Center data archive. Funk, C., Peterson, P., Harrison, L. et al. The Climate Hazards Center Infrared Precipitation with Stations, Version 3. Sci Data 13, 718 (2026). Data: https://doi.org/10.15780/G2JQ0P. Licensed under CC BY 4.0; aggregated by TechnicalGIS.
See the output terms and the dataset licence: CC BY 4.0.