Monthly rainfall in Sydney, 1976 to 2025
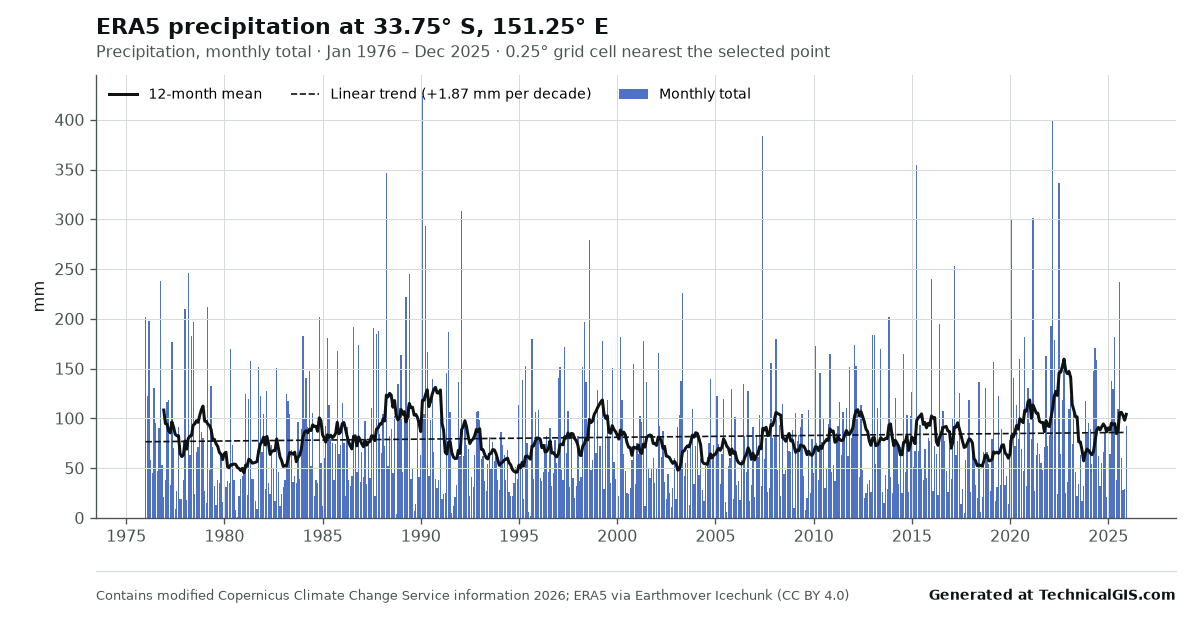
ERA5 monthly precipitation totals for Sydney over fifty years, with a 12-month mean to show wet and dry phases.
About this output
Monthly total precipitation for the ERA5 grid cell containing Sydney, January 1976 to December 2025, with a 12-month running mean. Reanalysis precipitation is modelled rather than gauged and is best used for patterns and anomalies rather than exact local totals.
Credit and reuse
You may reuse this output, including commercially, provided the line "Generated at TechnicalGIS.com" and the following credit are kept with it:
Contains modified Copernicus Climate Change Service information 2026. Neither the European Commission nor ECMWF is responsible for any use that may be made of the Copernicus information or data it contains. Hersbach, H. et al. (2023): ERA5 hourly data on single levels from 1940 to present, Copernicus Climate Change Service (C3S) Climate Data Store, https://doi.org/10.24381/cds.adbb2d47. Accessed through Icechunk ERA5 by Earthmover (CC BY 4.0), https://registry.opendata.aws/earthmover-era5/.
See the output terms and the dataset licence: CC BY 4.0 (Earthmover edition); Copernicus licence (CC BY 4.0) for the underlying ERA5 data.