Climate and satellite time-series gallery
Outputs generated with the climate time-series tools for places where the record tells a clear story. Each item includes the chart or time-lapse, the data behind it, the exact request used and the required credit. Open an item to download it, or to run the same request for another place.
-
 ERA5
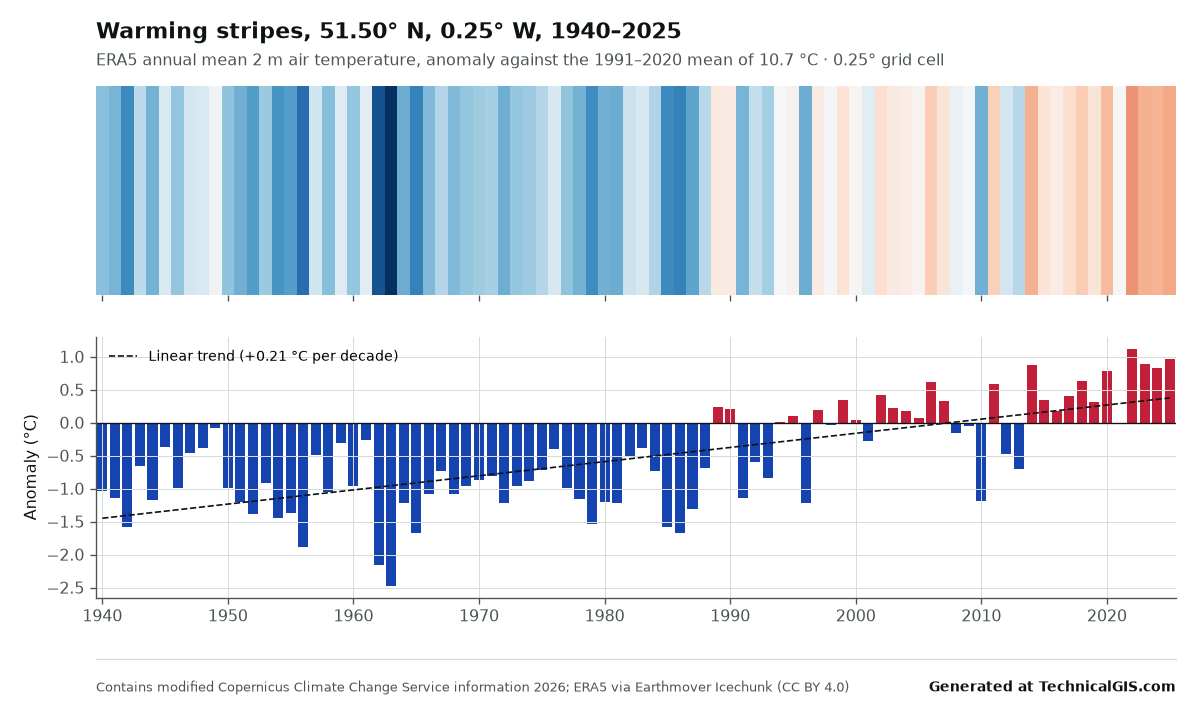
Warming stripes for London, 1940 to 2025
Annual mean temperature anomalies for central London from ERA5, drawn as warming stripes against the 1991 to 2020 mean.
-
 ERA5
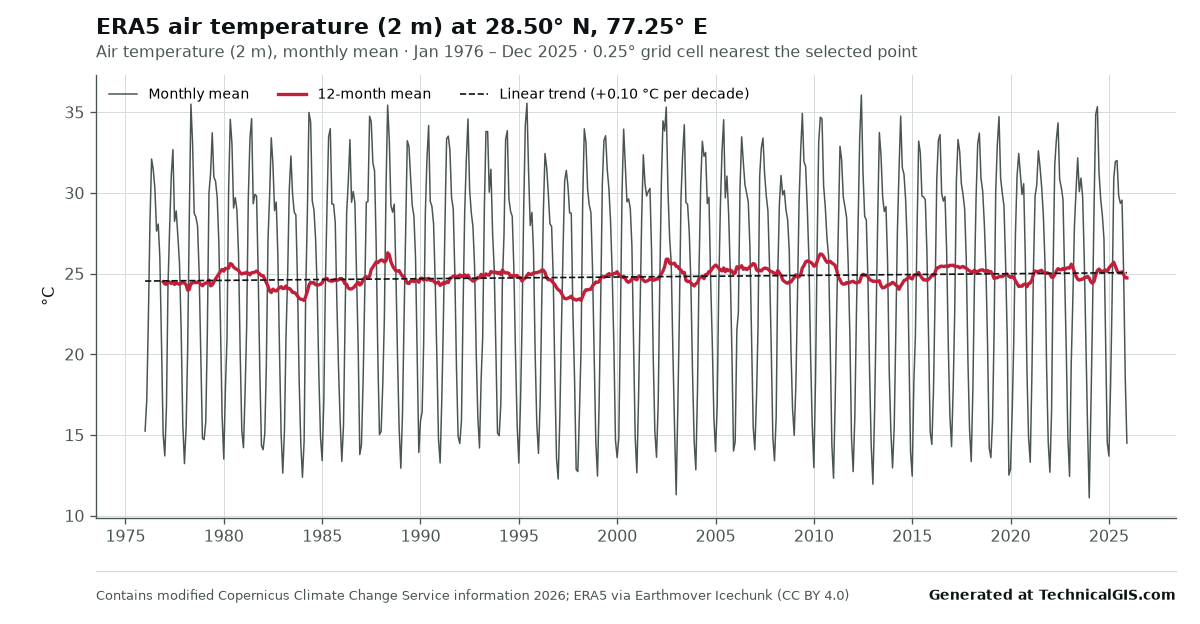
Monthly temperature in New Delhi, 1976 to 2025
Fifty years of ERA5 monthly mean air temperature for New Delhi, with a 12-month mean and a deseasonalised linear trend.
-
 ERA5
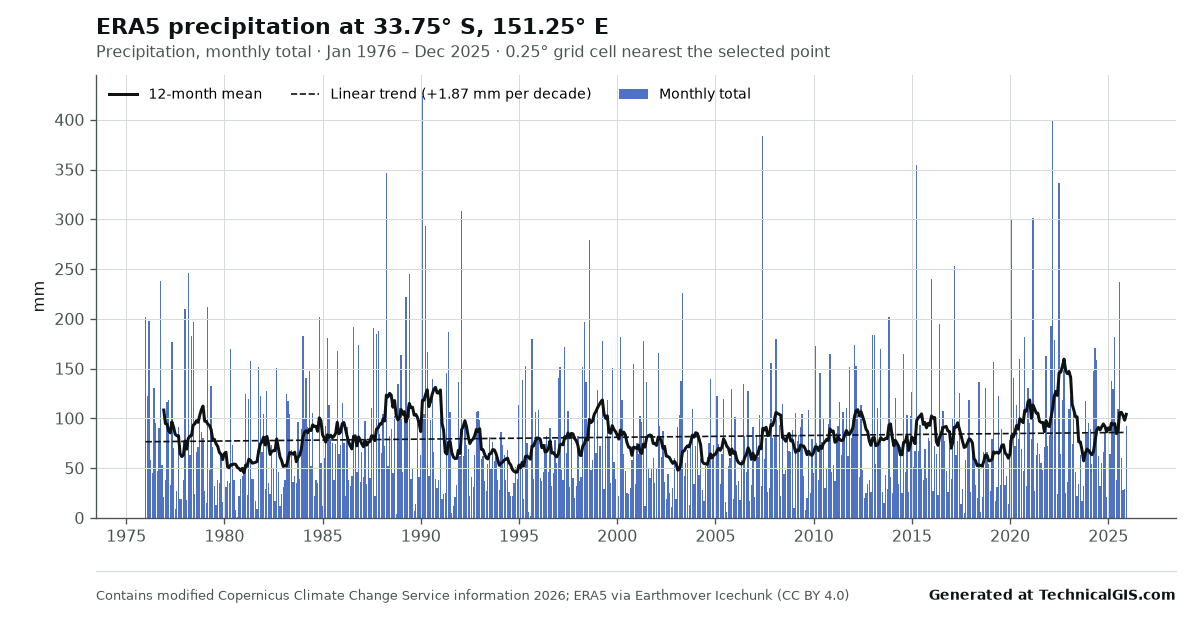
Monthly rainfall in Sydney, 1976 to 2025
ERA5 monthly precipitation totals for Sydney over fifty years, with a 12-month mean to show wet and dry phases.
-
 CHIRPS
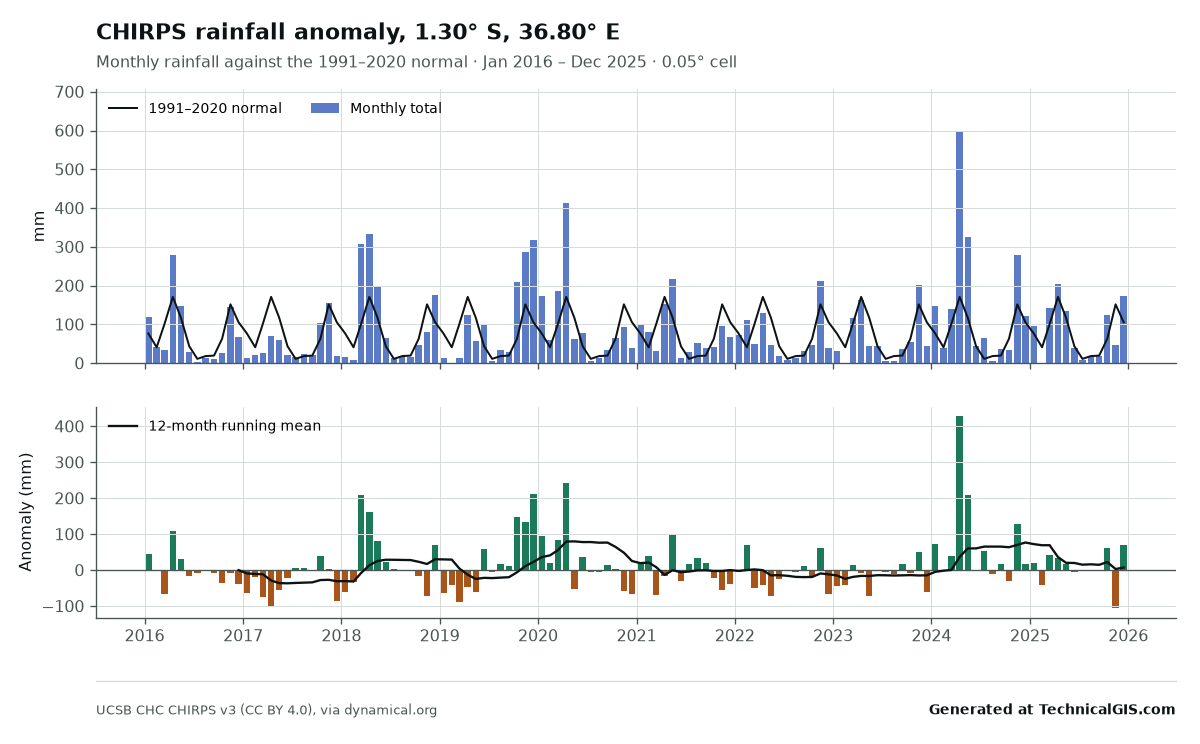
Rainfall against the normal in Nairobi, 2016 to 2025
CHIRPS monthly rainfall for Nairobi compared with the 1991 to 2020 normal, highlighting the failed and exceptional rainy seasons.
-
 CHIRPS
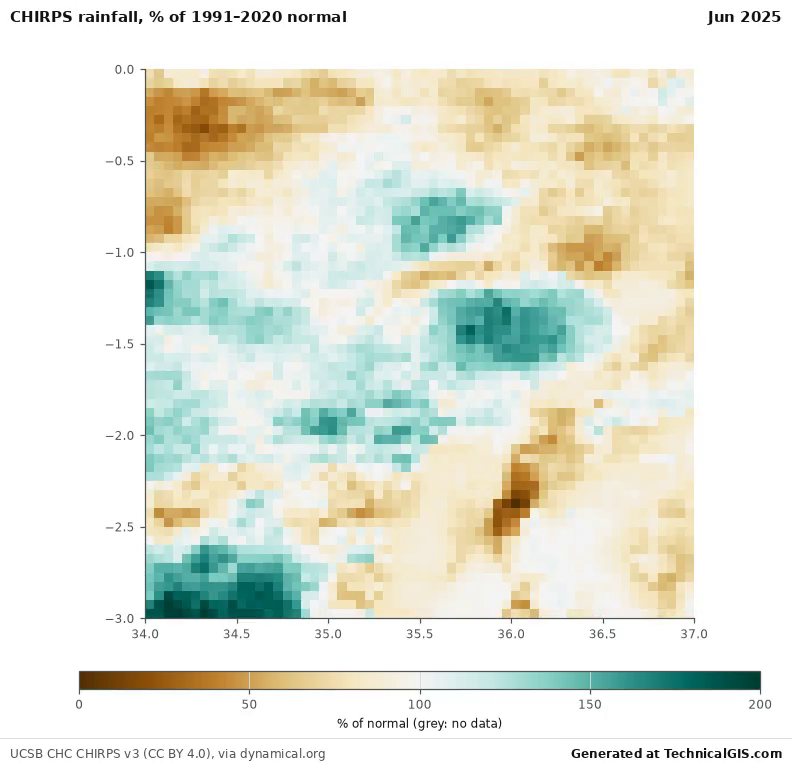
Rainfall anomaly map, southern Kenya and northern Tanzania, 2023 to 2025
An animated CHIRPS map of monthly rainfall as a percentage of the 1991 to 2020 normal, July 2023 to June 2025.
-
 Sentinel-2
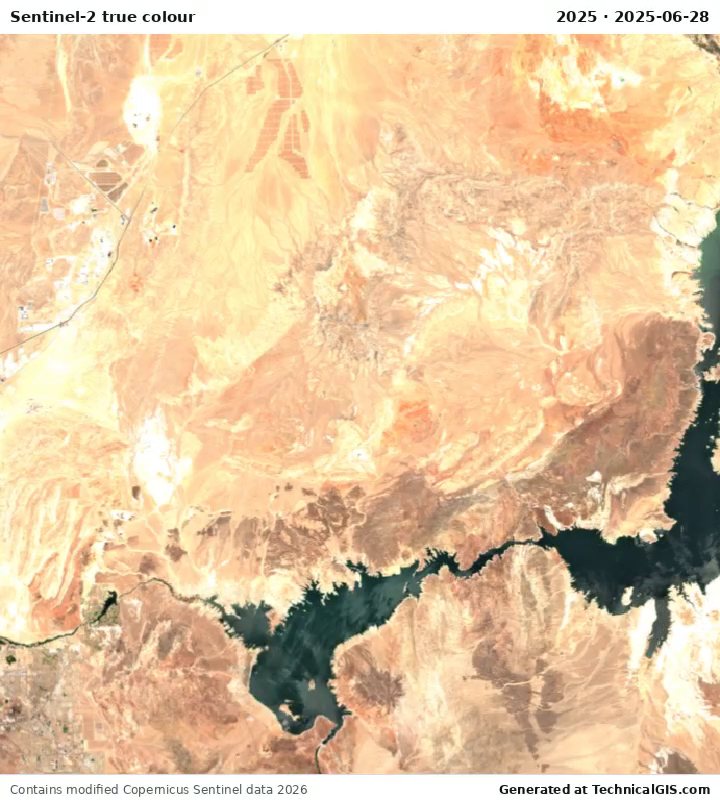
Lake Mead from Sentinel-2, 2017 to 2025
Annual cloud-free Sentinel-2 true-colour composites of Lake Mead, showing the reservoir's decline to its 2022 low and partial recovery.
-
 Landsat
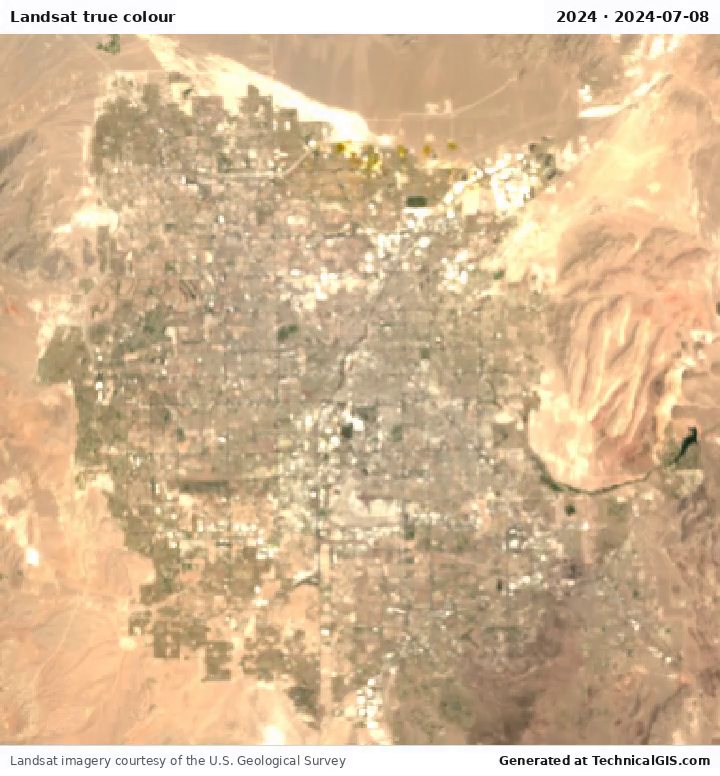
Urban growth of Las Vegas from Landsat, 2000 to 2024
Twenty-five years of annual Landsat true-colour composites showing the expansion of the Las Vegas Valley into the surrounding desert.
-
 Sentinel-2
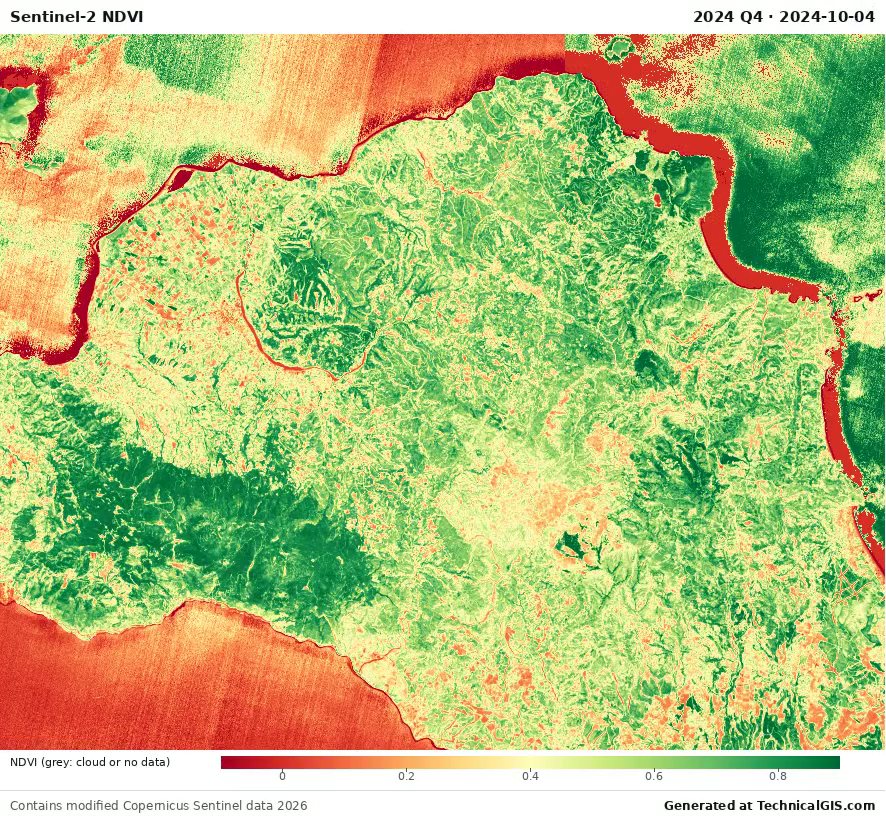
Vegetation loss and regrowth after the 2021 north Evia wildfire
Quarterly Sentinel-2 NDVI for north Evia, showing the burn scar of the August 2021 wildfire and the slow recovery of vegetation.
-
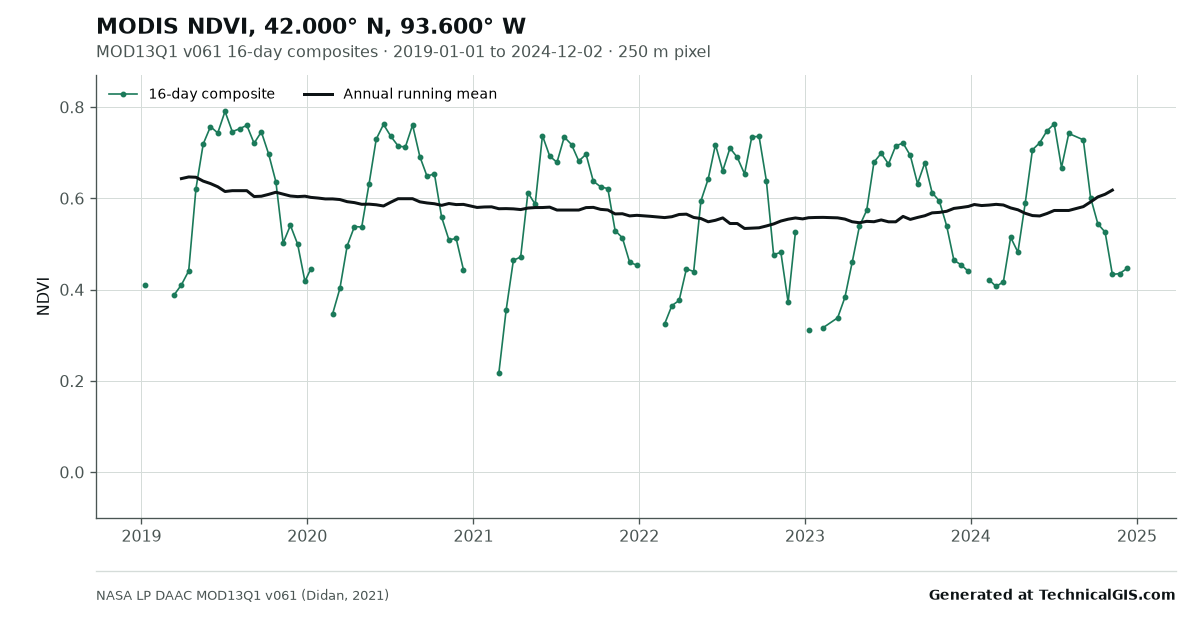 MODIS NDVI
Crop growing seasons in central Iowa from MODIS NDVI, 2019 to 2024
Sixteen-day MODIS NDVI for maize and soybean cropland in central Iowa, showing six growing seasons.
-
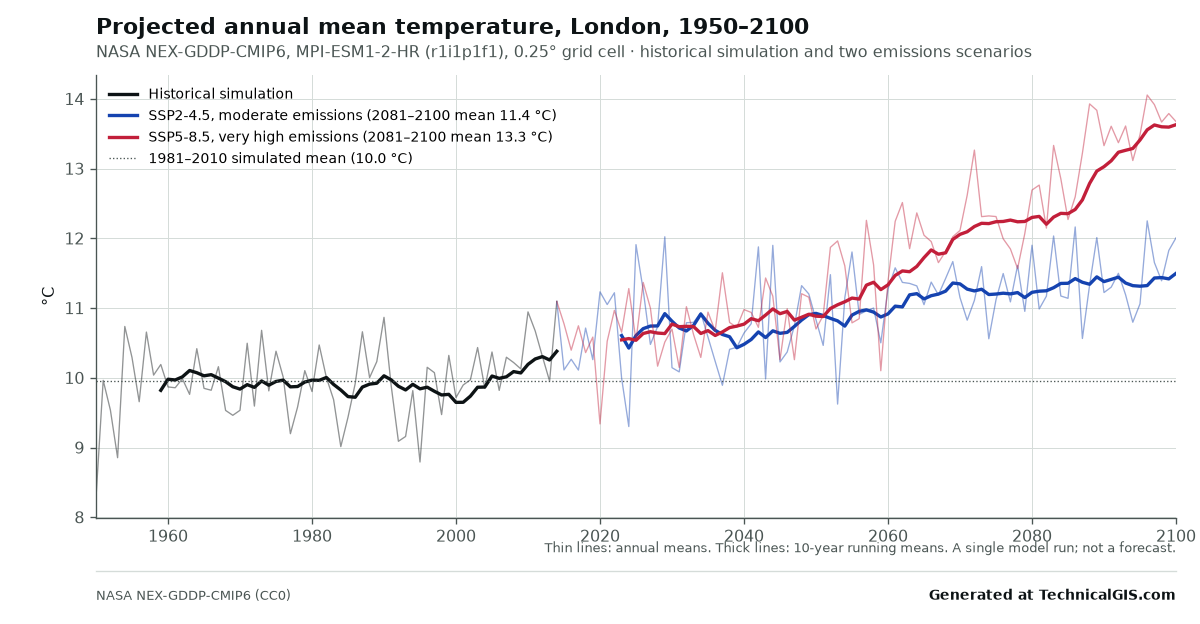 NASA NEX-GDDP-CMIP6 projections
Projected annual temperature for London to 2100 (CMIP6)
Downscaled CMIP6 annual mean temperature for London from 1950 to 2100 under a moderate and a very high emissions scenario.
Reusing gallery items
Gallery items may be reused, including commercially, provided the line "Generated at TechnicalGIS.com" and the dataset credit shown with each item are kept. The methodology explains how each output is produced and the licence of each dataset.