Watching car parks from space: what Sentinel-1 radar shows about Walmart's shoppers
Free Sentinel-1 radar measured 134 Walmart car parks across the United States on every pass from 2017 to November 2026. It shows the stores that closed, the Christmas rush, Friday evenings and the spring 2020 lockdowns. Here is how it compares with the transaction figures Walmart publishes, what it cannot show, and which other satellite data helps.

Key takeaways
- Parked cars make an asphalt car park brighter to radar. Across 134 Walmart Supercenters, free 10 m Sentinel-1 imagery picks this up on every pass since 2017.
- Store closures stand out clearly. The five closed stores' car parks darkened by an average of 1.93 dB, against −0.07 ± 0.97 dB for open stores over the same dates (p = 0.00002).
- Shopping rhythms show up in the evening passes but not at dawn, when car parks are nearly empty. From Black Friday to Christmas Eve, evening car parks were 0.39 dB brighter than in October, and Friday evenings 0.18 dB brighter than Sundays.
- Against Walmart's quarterly comparable transactions, the radar agrees well only through the pandemic (r = 0.81). In ordinary quarters, the changes in shopper numbers are smaller than the radar's year-to-year noise.
Short answer: yes, free satellite radar can tell how busy a big car park is, in aggregate. Parked cars make asphalt brighter to Sentinel-1. Across 134 Walmart Supercenters and nearly ten years of passes, the radar shows store closures plainly, and it shows the Christmas rush, Friday evenings and the spring 2020 lockdowns as smaller, consistent shifts. It cannot count cars. Its agreement with Walmart’s published quarterly transactions is strong only when shopping changed a lot, as it did in the pandemic.
Satellite views of car parks have a long history in retail analysis. Counting cars outside big stores became a well-known example of “alternative data” in the 2010s, built on very-high-resolution optical imagery bought by the scene. This article asks a humbler question with free data. With Sentinel-1, the European Space Agency’s radar mission, which images the whole of the United States every 12 days whatever the weather, can we see shoppers come and go?
This is Part 1 of Retail from space. Part 2, on 25 November, is a step-by-step Python tutorial for the method, and Part 3, on 2 December, turns to choosing where a new store should go.
Why radar can see parked cars
A radar satellite sends out microwave pulses and records what comes back. Smooth asphalt acts like a mirror and sends most of the pulse away from the satellite, so an empty car park is dark. A parked car is a box of flat metal panels sitting on that mirror. Pulses bounce from the ground to the side of the car and straight back, a “double bounce” that makes the car bright. More cars, more bounces, a brighter car park.
Sentinel-1’s pixels are 10 m across, about the size of four parking spaces. So the radar cannot pick out a car, but it can measure the average brightness of a whole car park, and that average rises as the car park fills.
Three things make this harder than it sounds. Speckle, the grainy interference of every radar image, adds noise to each pixel. Rain and dew change how the asphalt itself reflects. And the satellite passes at the same two times each day, about 06:40 and 18:45 local time in the United States, so it only ever sees the car park at those moments.
What we measured
We took 128 open Walmart Supercenters across the Sun Belt, from southern California to South Carolina, where snow and frost rarely cover the ground. We added the six stores that Walmart closed in March and April 2023 and that fell within the regular Sentinel-1 coverage. For each store:
- the store and its building came from Overture Maps;
- the car park was the paved ground within 110 m of the building, with other buildings and public roads removed;
- that area was trimmed to paved surfaces with the 0.6 m NAIP aerial photographs, using their near-infrared band to drop grass and trees;
- the store’s own roof was kept as a control. A roof is flat and does not fill with cars, so if the roof brightens too, the cause is the weather or the satellite, not shoppers.
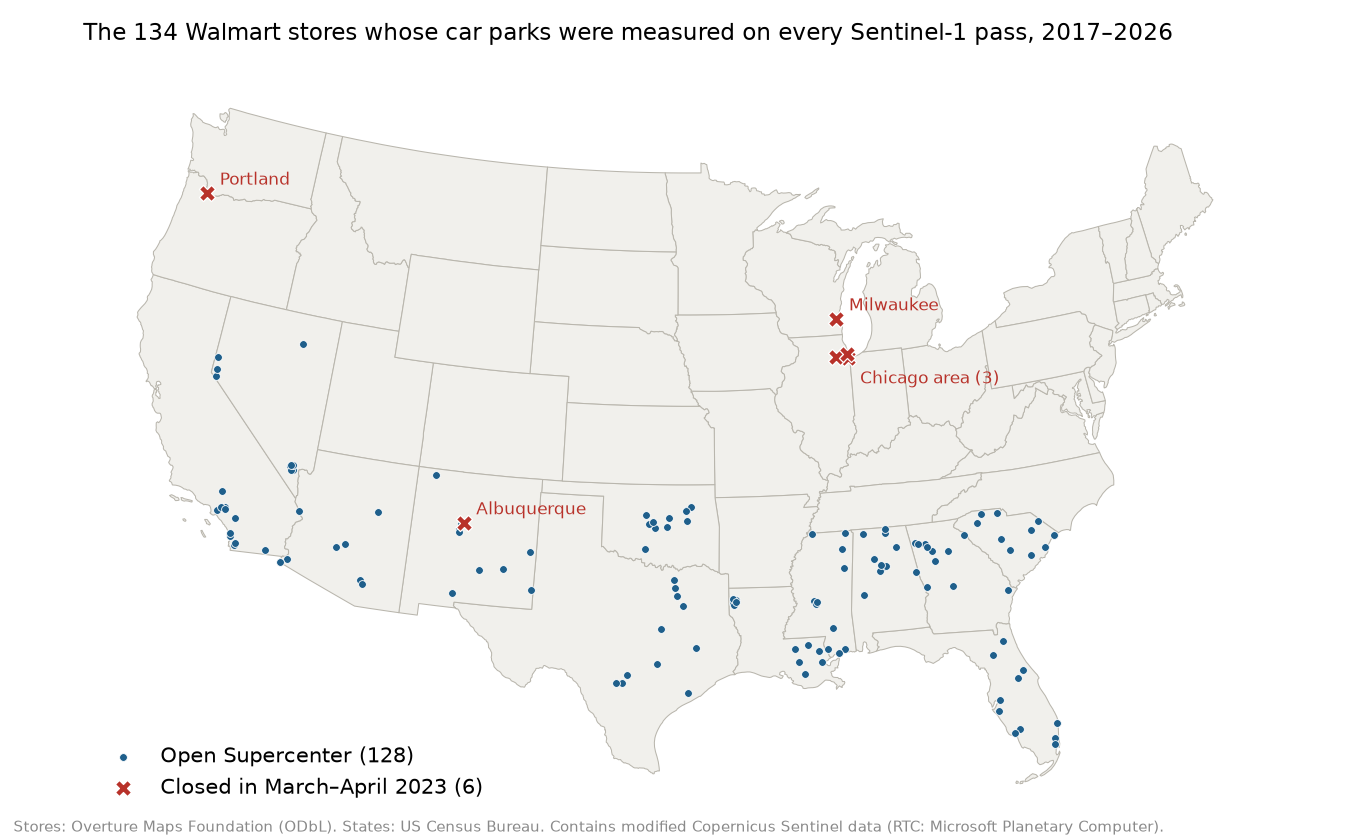
We then read every Sentinel-1 pass from January 2017 to 19 November 2026 over every store, in the terrain-corrected (RTC) form that Microsoft’s Planetary Computer publishes. That gave 68,251 store passes. Each orbit sees a store from the same angle every time, so we compared every store only with itself on the same orbit, and measured changes rather than levels.
Closures: the clearest test
The best test of any measure of shoppers is a store that loses all of them. Walmart closed six of the stores in our sample in spring 2023:
- Homewood, Illinois, and Plainfield, Illinois, by 10 March, as Walmart told Progressive Grocer;
- Milwaukee, Wisconsin, on W Silver Spring Drive, by 10 March (Milwaukee Journal Sentinel);
- Albuquerque, New Mexico, on San Mateo Boulevard SE, on 10 March (Nexstar, via The Hill);
- Portland, Oregon, on N Hayden Meadows Drive, on 24 March (Portland Tribune);
- Chatham in Chicago by 16 April, in Walmart’s own announcement.
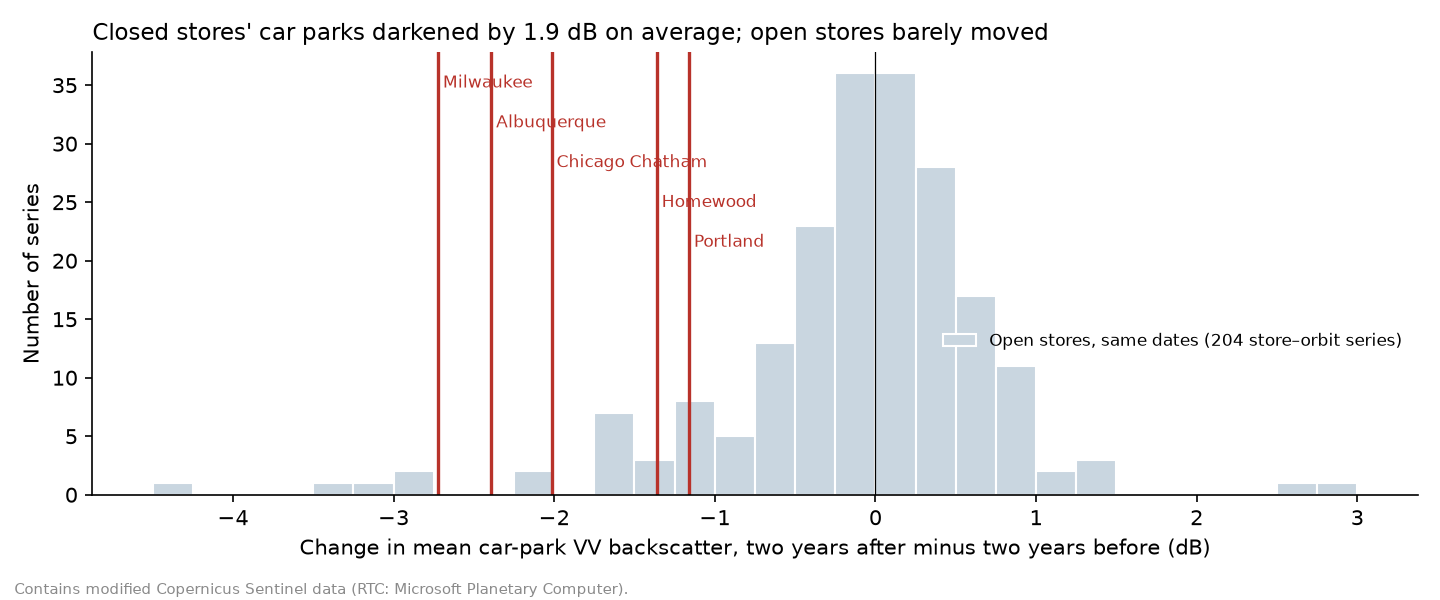
Plainfield sits at the very edge of the regular satellite track and had only six usable passes, too few to test, so five stores remain. For each, we compared the average car-park brightness in the two years after closing with the two years before. Then we did exactly the same at every open store on the same dates, as a placebo.
| Store | Change in car-park brightness |
|---|---|
| Milwaukee, W Silver Spring Dr | −2.72 dB |
| Albuquerque, San Mateo Blvd SE | −2.39 dB |
| Chicago, Chatham | −2.02 dB |
| Homewood, Illinois | −1.36 dB |
| Portland, N Hayden Meadows Dr | −1.16 dB |
| Five closed stores, mean | −1.93 dB |
| 204 open-store series, same dates | −0.07 ± 0.97 dB |
All five closed car parks darkened, by an average of 1.93 dB, about 36% less returned energy. The open stores barely moved, on average. A Mann–Whitney test puts the chance of a gap this large arising by luck at p = 0.00002. Only 3.4% of open-store series fell as far as the closures did on average.
The spread of the open stores matters as much as the result. Their standard deviation of 0.97 dB means that one store alone could darken by 1.2 dB without closing: 9.8% of open stores did as much as Portland. Car parks are resurfaced, shared with other shops, or rebuilt. One closure on its own would be suggestive; five together are hard to explain any other way. The car parks also darkened 1.83 dB more than their own roofs, which rules out a change in the weather or the satellite.
We checked the pictures too. NAIP aerial photographs of Homewood from September 2021 and July 2023 show a thinning car park becoming almost empty after the closure. Part 2 of this series, out on 25 November, builds this test step by step for the Chicagoland stores.
Christmas and Friday evenings
Closures are the extreme case. Day-to-day shopping is a much smaller signal, and here the two daily passes become useful. At 06:40, before the morning rush, a Supercenter car park holds mainly staff cars. At 18:45, it holds the evening shoppers. So anything that changes with shopping should show in the evening passes and not at dawn, while anything that changes with the weather or the season should show in both.
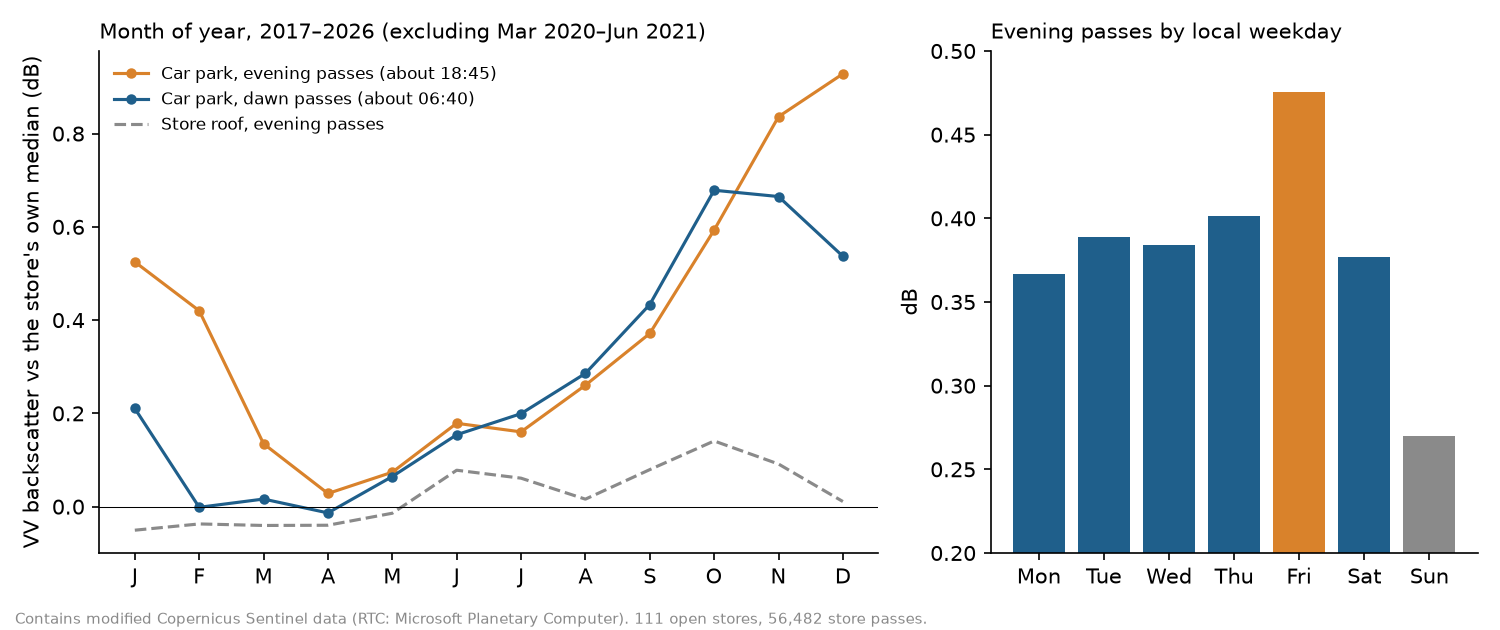
Both curves rise through the autumn, at dawn as much as in the evening. That shared part is the season: moisture, temperature and low sun angles change how asphalt reflects. But from November the two curves part. From Black Friday to Christmas Eve, evening car parks were 0.39 dB brighter than in October, while dawn car parks were 0.13 dB darker. That difference is the Christmas shopping.
The weekday pattern tells the same story. Evening car parks are brightest on Fridays and darkest on Sundays. The Friday–Sunday difference is 0.18 dB (t = 6.9, p = 7 × 10⁻¹¹, across 182 store-orbit series). The roofs, measured on the same passes, differ by just 0.003 dB.
Spring 2020
The pandemic gave the strongest change in shopping in the record. In April and May 2020, Americans shopped less often and bought more on each trip, and Walmart’s comparable transactions fell 5.6% in the quarter to April and 14.0% in the quarter to July, from its Q1 and Q2 fiscal 2021 releases.
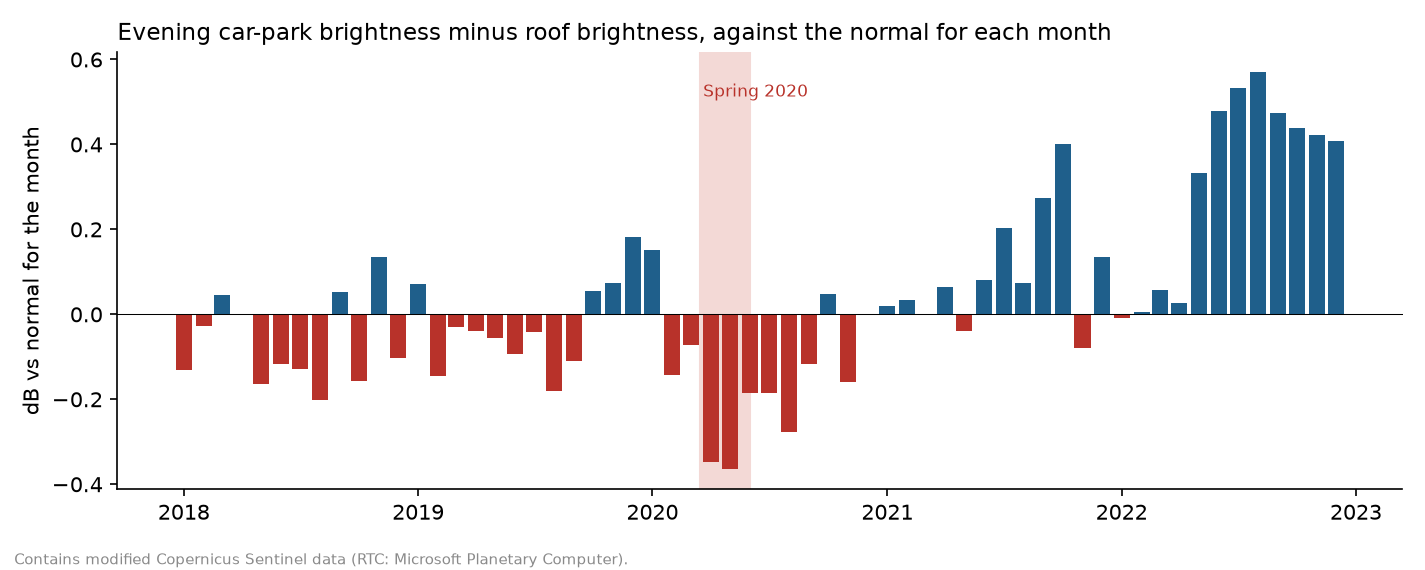
Against the same months of 2018 and 2019, evening car parks in April and May 2020 were 0.14 dB darker, while roofs on the same passes were 0.15 dB brighter (p = 2.7 × 10⁻⁶, 168 store-orbit series). Dawn car parks, which hold few shoppers at any time, did not darken: they rose by 0.09 dB. With the roof taken out, the evening car parks were 0.35 dB below normal in April and 0.37 dB in May, the lowest values in the record, and recovered through June.
Does it match Walmart’s own figures?
Walmart does not publish visit numbers for individual stores. Each quarter, though, it reports Walmart U.S. comparable sales, split into the change in transactions and in average ticket, in earnings releases filed with the US Securities and Exchange Commission. We collected all 39 quarters from fiscal 2018 to the third quarter of fiscal 2027, the latest released on 19 November 2026, from Walmart’s filings on EDGAR.
For each quarter, we took the evening car-park-minus-roof brightness across all open stores and compared it with the same quarter a year earlier. Walmart’s fiscal year ends in January, so the quarters match its releases.
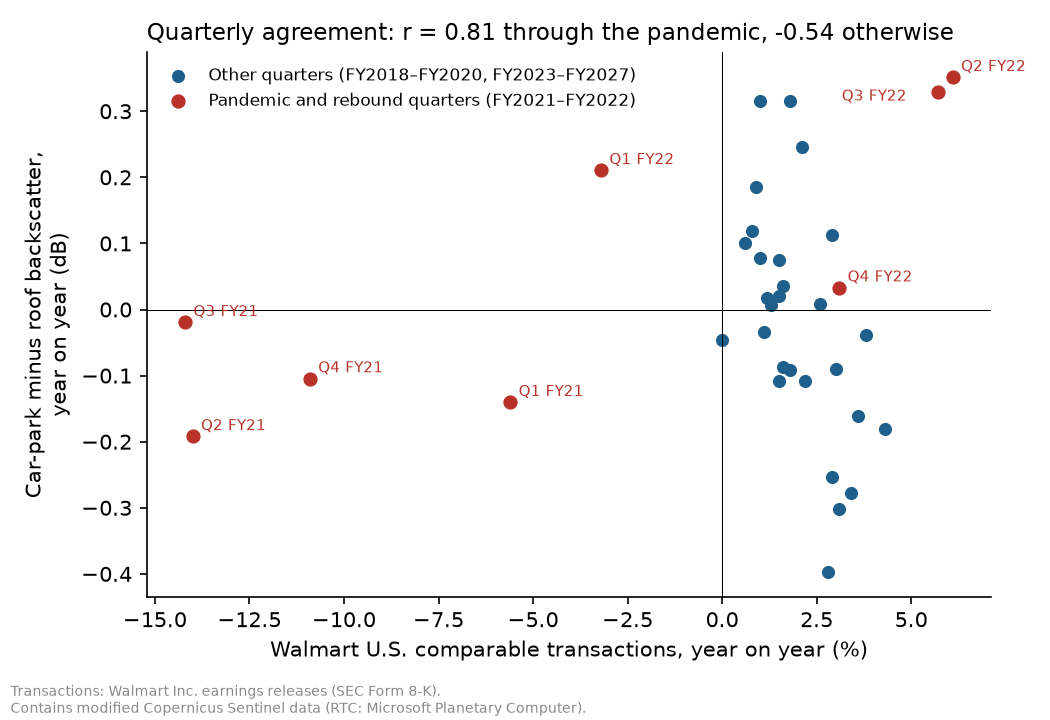
| Quarters | n | Correlation with comparable transactions |
|---|---|---|
| All quarters | 36 | r = 0.15 (p = 0.38) |
| Pandemic and rebound, fiscal 2021–2022 | 8 | r = 0.81 (p = 0.014) |
| All other quarters | 28 | r = −0.54 (p = 0.003) |
Through the pandemic, the radar follows the transactions closely. Fewer trips in 2020 meant darker car parks, and the return of shoppers in mid-2021, when transactions rose 6.1% and 5.7% year on year (Q2 and Q3 fiscal 2022), meant brighter ones.
Outside those two years, there is no useful agreement, and the correlation even turns negative. The reason is scale. Walmart’s comparable transactions usually move by 1% to 4% a year. Our closures suggest that a full car park becoming empty is worth about 2 dB, so a 1% change in shoppers is worth roughly 0.015 dB. The quarterly radar index has an uncertainty of about 0.11 dB. An ordinary year’s change in shoppers is simply too small to see through it.
What the radar picks up instead in those quarters is the environment. The year-on-year changes in the dawn passes, which hold few shoppers, correlate with those in the evening passes (r = 0.56), and the dawn passes alone correlate with transactions outside the pandemic at r = −0.38. Wetter or drier years shift both passes together, and in this period they happened to run against the sales figures. Restricting the record to one satellite, Sentinel-1A, to remove the change when Sentinel-1B failed in December 2021, gives r = 0.22 overall: no better.
Two more points to keep in mind. Comparable transactions include online orders from fiscal 2020, and before that Walmart reported “traffic”, so neither measures cars at stores alone. And our 128 stores are a sample of the Sun Belt, not of all Walmart’s US stores.
What the radar can and can’t show
It can show:
- stores opening, closing or being rebuilt, as changes of 1 dB or more over months;
- seasonal and weekly shopping rhythms, averaged over many stores and years;
- big shocks that affect many stores at once, such as the spring 2020 lockdowns.
It can’t show:
- the number of cars, or the number of shoppers, at a given time;
- small changes at one store, or ordinary quarter-to-quarter changes in sales;
- anything outside its two daily passes. It never sees the lunchtime or Saturday-afternoon peak.
For a single store, the noise of about 1 dB in a two-year average means that only a change of around half the car park or more is clear on its own.
Better or complementary data
Sentinel-1 is free, global and unaffected by cloud, which is why we built on it. Other sources fill different gaps.
| Source | Resolution and timing | What it adds | Licence |
|---|---|---|---|
| NAIP aerial photographs (USDA) | 0.6–1 m, each state about every two years | Individual cars can be counted; we used it to map paved ground and check the closures | Public domain |
| Sentinel-2 (ESA) | 10 m optical, every 5 days | A second, optical view of large car parks | Free, with attribution |
| Umbra and Capella open SAR | 0.25–1 m spotlight radar, chosen sites only | Radar that resolves single cars | CC BY 4.0 |
| VIIRS Black Marble (NASA) | 500 m night lights, daily | Activity of whole towns and regions | Public domain |
| PlanetScope, Maxar, Airbus | 0.3–3 m optical, daily to weekly | Car counts at chosen stores, the basis of commercial products | Commercial |
NAIP is the most useful companion. It shows cars directly, so it can calibrate the radar, but it flies in mid-morning and only every couple of years, so it cannot make a time series. Umbra and Capella publish sample scenes under an open licence, but we found none over the stores in our sample. Sentinel-2 is too coarse to separate cars from asphalt reliably and often blocked by cloud. VIIRS night lights suit regions rather than single stores. Commercial imagery can count cars at chosen stores on chosen days, but its licences generally restrict publishing the images, so we have not used it here.
From busy stores to new ones
Measuring how busy a store is leads to the question retailers ask first: where should a store go at all? That is a GIS question, built on drive-time catchments, households and income from the census, the location and size of competing stores, road access, and a model of how shoppers choose between stores.
We have kept it for Part 3, a tutorial of its own, because it needs a different set of data and tools. It works through metro Albuquerque with open data and Python, from road network to Huff gravity model, and replays 2022 to see how the San Mateo Boulevard SE store looked before it closed.
Methods in brief
- Stores: Walmart Supercenters from Overture Maps places, release 2026-11-18.0, about 11 per state in Arizona, Nevada, New Mexico, Texas, Oklahoma, Louisiana, Mississippi, Alabama, Georgia, Florida, South Carolina and southern California, chosen for large, open car parks; plus six stores closed in 2023.
- Masks: paved ground within 110 m of the store building, without other buildings or public roads (Overture Maps), trimmed with NAIP near-infrared to drop vegetation. The roof is the Overture building footprint.
- Radar: Sentinel-1 RTC, VV polarisation, gamma-nought, from the Microsoft Planetary Computer, January 2017 to 19 November 2026. Each pass gives the mean linear backscatter of the car park and the roof, converted to dB. Averaging a few hundred pixels per car park reduces speckle.
- Comparisons: every store against itself on the same relative orbit, so that viewing angle stays fixed. Evening (ascending) and dawn (descending) passes analysed separately.
- Closures: mean car-park brightness from 30 days to two years after closing, minus the two years before, requiring at least 10 passes on each side. The placebo uses every open store-orbit series with the same dates.
- Quarterly index: for every open store-orbit series with at least two evening passes in a Walmart fiscal quarter, the mean car-park-minus-roof brightness, minus the same quarter a year earlier; then the mean of those changes across series, keeping quarters with at least 20 series.
Frequently asked questions
Can Sentinel-1 count cars in a car park?
No. Its pixels are 10 m across, so one pixel covers several parking spaces. It measures how bright the whole car park is to radar, which rises as more of it is covered by cars.
Why compare the car park with the store roof?
The roof sees the same weather and the same satellite on the same pass, but never fills with cars. If both brighten, the cause is the environment; if only the car park brightens, it is the cars.
Why are the evening and dawn passes treated differently?
Sentinel-1 passes the US at about 06:40 and 18:45 local time. At dawn a Supercenter car park holds few shoppers, so the dawn passes show what the environment alone does, and the evening passes show the environment plus the shoppers.
Does this predict Walmart’s sales?
No. Outside the pandemic, the radar index did not track Walmart’s published comparable transactions at all, because ordinary changes in shopper numbers are far smaller than the radar’s year-to-year noise. It is a tool for studying how car parks are used, not a forecast of any company’s results.
Can I do this myself for free?
Yes. Sentinel-1 RTC and NAIP are free on the Microsoft Planetary Computer, store and building locations are free from Overture Maps, and Part 2 of this series, out on 25 November, gives the Python code.
Data and licences
- Sentinel-1: contains modified Copernicus Sentinel data 2017–2026, radiometrically terrain corrected by Microsoft Planetary Computer.
- NAIP: USDA Farm Production and Conservation Business Center, public domain.
- Stores, buildings and roads: Overture Maps Foundation, release 2026-11-18.0, including data © OpenStreetMap contributors under the ODbL.
- State boundaries: US Census Bureau, public domain.
- Walmart U.S. comparable sales, transactions and average ticket: Walmart Inc. quarterly earnings releases, fiscal 2018 to the third quarter of fiscal 2027, filed as Form 8-K exhibits on SEC EDGAR.
- Store closures: as cited in the closures section above.
Walmart and Supercenter are trademarks of Walmart Inc., used here only to identify its stores and published figures. TechnicalGIS is not affiliated with or endorsed by Walmart Inc.
Key terms
- Backscatter
- The share of a radar pulse that comes back to the satellite from the ground, usually given in decibels (dB). Smooth asphalt returns little; cars, with their flat panels and corners, return more.
- Decibel (dB)
- A logarithmic scale: +1 dB is about 26% more energy and −2 dB about 37% less.
- RTC
- Radiometric terrain correction: processing that removes the effect of slope and viewing geometry, so that pixels from different passes can be compared.
- Placebo test
- Running the same analysis where nothing happened, here at open stores on the closure dates, to see how often the 'effect' turns up by chance.
- Comparable transactions
- Walmart's year-on-year change in the number of transactions at stores and online channels open at least a year, published each quarter.
Data for this article
- Microsoft Planetary Computer · Sentinel-1 RTC and NAIP imagery
- Copernicus Data Space Ecosystem · the original Sentinel-1 archive
- Overture Maps · store locations, buildings and roads
- NAIP aerial imagery · 0.6 m aerial photographs, about every two years
Licences and formats for each source are listed in the GIS data sources catalogue.


