#Overture Maps

3 posts

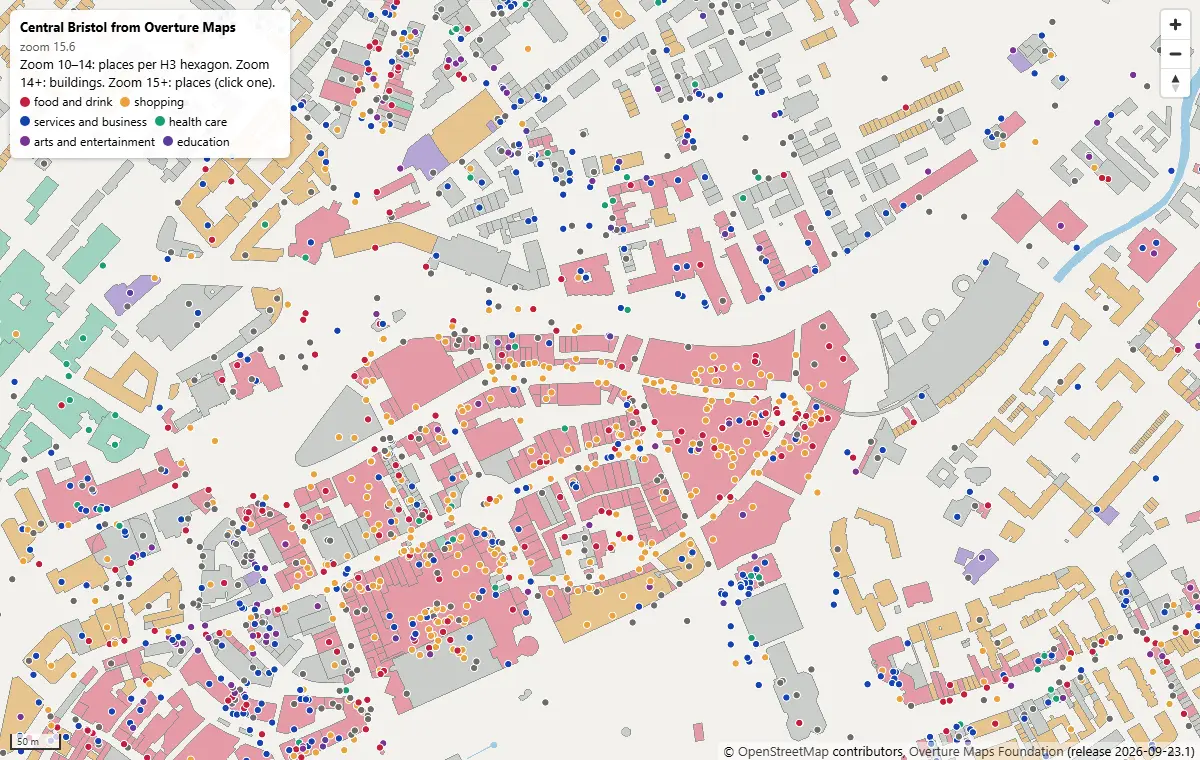
MapLibre GL JS map of central Bristol at zoom 15.6, with Overture building footprints coloured by subtype and places as coloured dots by category, around Broadmead and Cabot Circus

Tutorial Python Part 2 of 2

PMTiles vector tiles in Python and a MapLibre GL JS web map

Turn Overture Maps GeoParquet into PMTiles vector tiles with the GDAL that ships in pyogrio, no Tippecanoe needed, measure the zoom-level and size trade-offs, and serve an interactive MapLibre GL JS map of Bristol from static hosting.
Intermediate 12 min read

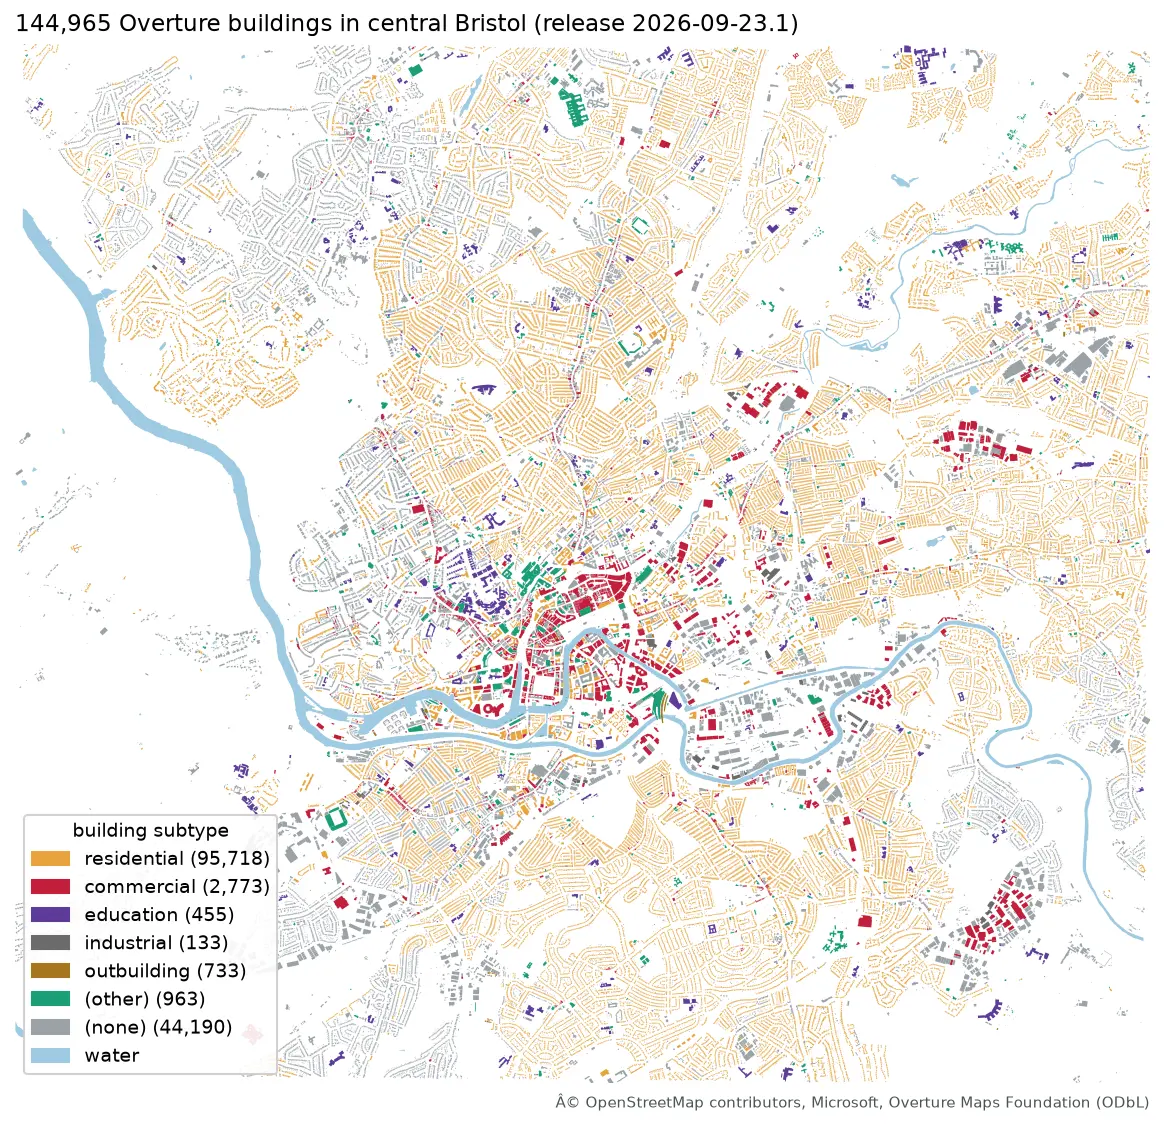
Map of central Bristol with 144,965 Overture building footprints coloured by subtype, most of them residential, and the River Avon in blue

Tutorial Python Part 1 of 2

Query Overture Maps with DuckDB spatial and GeoParquet in Python

Pull Bristol's 144,965 buildings and 20,727 places straight from the Overture Maps GeoParquet release with DuckDB, run spatial SQL joins and H3 aggregation, load the result into GeoPandas, write GeoParquet 1.1, and time it against Shapefile, GeoPackage and FlatGeobuf.

Intermediate 13 min read

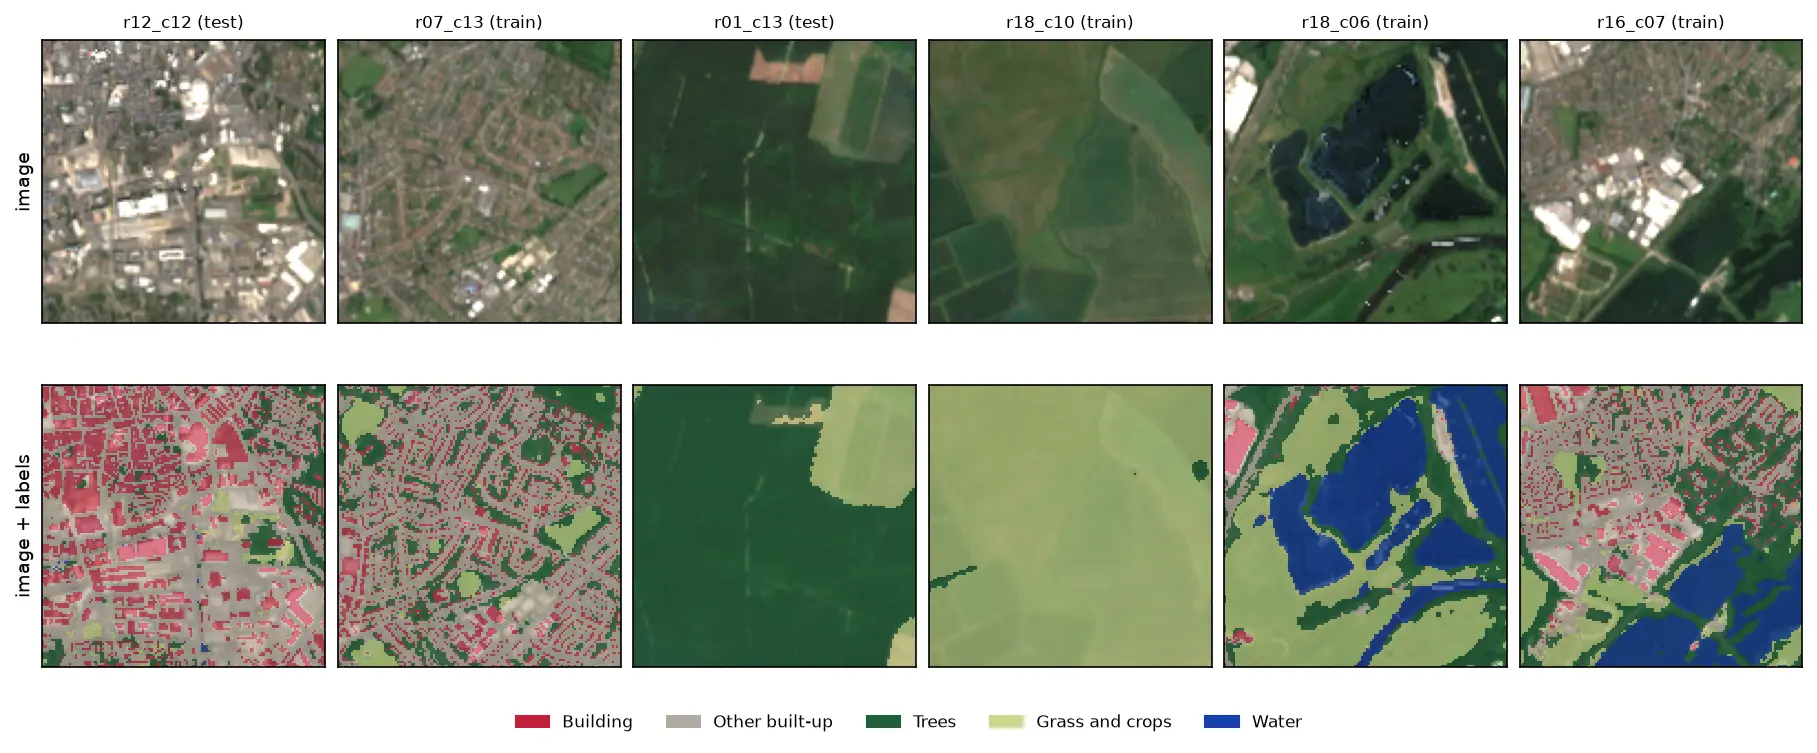
Six 128 by 128 pixel Sentinel-2 image chips of Nottingham, each shown above the same chip with its label mask overlaid: a city centre with red buildings and grey streets, a suburb, a forest, farmland, flooded gravel pits in blue and an industrial estate.

Tutorial Python Part 1 of 3

Training data for deep learning on satellite imagery: Sentinel-2 image chips in Python

Build a labelled deep learning dataset from free data: stream a Sentinel-2 L2A composite from the Planetary Computer, rasterise Overture building footprints over ESA WorldCover, cut georeferenced image chips, split them by spatial block so the test set does not leak, check the class balance and load it all as a TorchGeo dataset.

Intermediate 13 min read