Sentinel-1 soil moisture in Python: change detection checked against COSMOS-UK
Estimate surface soil moisture from free Sentinel-1 radar in Python with the TU Wien change-detection method. Build dry and wet references per orbit, map relative soil moisture at 100 m, and test it honestly against four COSMOS-UK stations and their rain gauges.
- Level
- Intermediate
- Tested with
- Python 3.12
- Source code
- Download scripts
Key takeaways
- Change detection turns two years of Sentinel-1 VV backscatter into relative surface soil moisture (0–100 %) using only the pixel's own driest and wettest values. No calibration data is needed.
- Against four COSMOS-UK stations, same-day agreement was Pearson r = 0.27–0.74. Smoothing the radar series with a soil water index (T = 40 days) raised it to 0.57–0.80, because COSMOS senses a deeper layer than C-band radar.
- Vegetation is the main error source. At Wimpole (arable) r fell from 0.45 in October–March to 0.11 in April–September, and on 9 May 2023, the wettest day in the record, growing crops made cropland look dry (median 27 %).
- The signal follows rain: relative soil moisture averaged 66–74 % after 10 mm or more of rain in three days and 25–36 % after three dry days, at all four sites.
Before you start
- Comfortable with NumPy and pandas; Sentinel-1 SAR flood mapping in Python introduces backscatter, decibels and speckle
- Python 3.10+ with pystac-client, planetary-computer, rasterio, pyproj, numpy, scipy, pandas, requests and matplotlib
- An internet connection: radar is streamed from the Microsoft Planetary Computer and in-situ data from the UKCEH COSMOS-UK API, with no account or API key
Short answer: to estimate soil moisture from Sentinel-1 in Python, use change detection. Stream a long VV backscatter time series for each pixel from the Planetary Computer’s sentinel-1-rtc collection. Separately for each relative orbit, take a low percentile as the dry reference and a high percentile as the wet reference. Each date’s relative surface soil moisture is then (σ⁰ − dry) / (wet − dry) × 100 %. It is relative (0–100 %), it describes only the top few centimetres, and vegetation and surface roughness can overwhelm it, so check it against in-situ data before you trust it.
Wet soil reflects more microwave energy than dry soil, because water raises the soil’s dielectric constant. A C-band radar such as Sentinel-1 sees that as brighter backscatter, through cloud and at night. The catch is that crops, tillage and roughness also change backscatter. The change-detection method from TU Wien, which underlies the operational Copernicus surface soil moisture products, sidesteps most of that by comparing each pixel only with its own history.
In this tutorial, we apply it to four soil moisture stations of the COSMOS-UK network in lowland England, two on arable land and two on grassland, and measure how well it works.
You will learn how to:
- download daily in-situ soil moisture and rainfall from the open COSMOS-UK API;
- extract a two-year Sentinel-1 VV time series over each station from every orbit that passes;
- build dry and wet references per orbit and convert backscatter to relative soil moisture;
- measure the agreement with COSMOS-UK, by season and with and without incidence angle handling;
- turn the noisy surface signal into a soil water index for deeper layers;
- make 100 m relative soil moisture maps and see where vegetation breaks them.
All outputs below are real results from soil_moisture.py, run on 23 October 2026 with Python 3.12, pystac-client 0.9.1, rasterio 1.5.2 and pandas 3.1.0. A full run takes about 45 seconds on a home broadband connection.
How does Sentinel-1 measure soil moisture?
Sentinel-1 sends a 5.6 cm (C-band) microwave pulse and records how much comes back. Over bare or sparsely vegetated soil, backscatter rises by roughly 0.1–0.3 dB for each 1 % (by volume) increase in moisture in the top 1–5 cm. Three things get in the way:
- Vegetation. Leaves and stems scatter and absorb the pulse. A growing wheat crop can change VV by several decibels with no change in soil moisture.
- Surface roughness. Ploughing, harrowing and rain-smoothed soil change backscatter as much as moisture does.
- Viewing geometry. Backscatter falls as the incidence angle grows. Different orbits see the same field at different angles, from 30° to 46° across the swath.
Change detection assumes that roughness and vegetation at a pixel are roughly constant, or at least vary less than moisture, so the pixel’s own driest and wettest values bracket its moisture range. The operational TU Wien products also normalise backscatter to a 40° incidence angle using a slope fitted per pixel, and correct for vegetation using the seasonal cycle of that slope. We use a simpler, common shortcut: separate references for each relative orbit, so the angle is fixed within each reference.
Step 1: in-situ soil moisture and rain from COSMOS-UK
COSMOS-UK stations measure soil moisture with a cosmic-ray neutron sensor. Fast neutrons produced by cosmic rays are slowed by hydrogen, mostly in soil water, so the count of neutrons above the ground tracks soil moisture over a footprint up to about 200 m in radius and 10–30 cm deep. That is much closer to a Sentinel-1 pixel cluster than a single probe. Each station also has a 10 cm point probe (TDT) and a rain gauge.
The UKCEH COSMOS-UK API is an OGC Environmental Data Retrieval (EDR) service, open under the Open Government Licence. It returns CoverageJSON:
SITES = {  # COSMOS-UK station code: (name, land cover, lat, lon)    "WIMPL": ("Wimpole", "arable", 52.1322, -0.0444),    "ROTHD": ("Rothamsted", "arable", 51.8136, -0.3778),    "CARDT": ("Cardington", "grassland", 52.1056, -0.4249),    "WADDN": ("Waddesdon", "grassland", 51.8389, -0.9478),}START, END = "2023-01-01", "2024-12-31"

def cosmos_daily(site: str) -> pd.DataFrame: """Daily COSMOS volumetric water content (%), 10 cm TDT probe (%) and rain (mm) as a DataFrame.""" r = requests.get(f"https://cosmos-api.ceh.ac.uk/collections/1D/locations/{site}", timeout=120, params={"datetime": f"{START}T00:00:00Z/{END}T00:00:00Z", "parameter-name": "cosmos_vwc,tdt1_vwc,precip"}) r.raise_for_status() cov = r.json()["coverages"][0] df = pd.DataFrame({p: cov["ranges"][p]["values"] for p in ("cosmos_vwc", "tdt1_vwc", "precip")}, index=pd.to_datetime(cov["domain"]["axes"]["t"]["values"]).date) df.index.name = "date" return df.astype(float) site name cover days cosmos_vwc_min cosmos_vwc_max tdt_10cm_min tdt_10cm_max rain_mmWIMPL Wimpole arable 731 20.4 56.4 17.6 46.9 1301ROTHD Rothamsted arable 731 15.0 44.5 19.2 43.3 1562CARDT Cardington grassland 731 10.2 37.3 11.5 44.7 1409WADDN Waddesdon grassland 731 21.7 56.7 14.8 47.9 1490All four sites have complete two-year records. 2023 and 2024 were wet years in England, but both summers had dry spells that took soil moisture down to 10–25 %.
Step 2: a Sentinel-1 time series over each station
The Planetary Computer’s sentinel-1-rtc collection has radiometrically terrain-corrected backscatter (γ⁰) as Cloud Optimised GeoTIFFs. We search by point, so we get every orbit that sees each station. We read a 400 × 400 m box, about the COSMOS footprint, onto a British National Grid raster with a WarpedVRT, so every orbit lands on the same grid, and we average the linear backscatter over the box. A pass can be split into two slices that both cover the site, so we merge records by time and orbit.
BNG = "EPSG:27700"                       # British National Grid: one metric CRS for every orbit and siteHALF = 200                               # 400 m x 400 m box: roughly the COSMOS footprint

def read_mean(href, transform, width, height, resampling=Resampling.nearest):    with rasterio.open(href) as src, WarpedVRT(src, crs=BNG, transform=transform, width=width, height=height,                                               nodata=0, resampling=resampling) as vrt:        a = vrt.read(1).astype("float32")    a[a <= 0] = np.nan    return a

def site_series(site: str) -> pd.DataFrame: _, _, lat, lon = SITES[site] x, y = to_bng.transform(lon, lat) tr = from_origin(x - HALF, y + HALF, 10, 10) items = list(catalog.search(collections=["sentinel-1-rtc"], intersects={"type": "Point", "coordinates": [lon, lat]}, datetime=f"{START}/{END}").items()) with ThreadPoolExecutor(8) as ex: chips = list(ex.map(lambda i: read_mean(i.assets["vv"].href, tr, 40, 40), items)) recs = defaultdict(list) for item, a in zip(items, chips): if np.isfinite(a).mean() > 0.9: recs[(item.datetime.strftime("%Y-%m-%d %H:%M"), item.properties["sat:relative_orbit"], item.properties["sat:orbit_state"], item.properties["platform"])].append(float(np.nanmean(a))) df = pd.DataFrame([{"time": k[0], "orbit": k[1], "pass": k[2], "platform": k[3], "vv": np.mean(v)} for k, v in recs.items()]) df["time"] = pd.to_datetime(df.time) df["date"] = df.time.dt.normalize() df["vv_db"] = 10 * np.log10(df.vv) # average in linear power, then convert to dB return df.sort_values("time")read in 23.4 s
WIMPL (Wimpole, arable): 165 acquisitions count mean std min maxorbit pass59 ascending 59 -8.88 1.69 -11.87 -5.8781 descending 52 -9.47 1.63 -12.82 -6.51132 ascending 54 -9.75 1.54 -13.13 -6.42
ROTHD (Rothamsted, arable): 106 acquisitions81 descending 52 -9.64 1.75 -13.01 -5.56132 ascending 54 -9.53 1.54 -13.52 -6.47
CARDT (Cardington, grassland): 154 acquisitions81 descending 52 -12.06 0.66 -13.37 -9.82132 ascending 54 -11.79 0.91 -13.49 -7.76154 descending 48 -11.88 0.65 -13.34 -10.27
WADDN (Waddesdon, grassland): 216 acquisitions30 ascending 56 -11.63 0.89 -14.13 -9.9681 descending 52 -11.58 1.02 -13.24 -9.45132 ascending 54 -11.05 1.21 -13.43 -8.49154 descending 54 -11.12 1.16 -13.51 -8.45Combining orbits gives a measurement every 3–7 days on average, instead of every 12. Only Sentinel-1A was flying in 2023–2024, because Sentinel-1B failed in December 2021. Two things already stand out. The arable sites vary about twice as much (standard deviation 1.5–1.8 dB) as the grassland sites (0.7–1.2 dB). Also, the orbit means differ by up to 0.9 dB at Wimpole: that is the incidence angle effect, plus some difference between morning (descending) and evening (ascending) passes.
Step 3: dry and wet references, per orbit
The change-detection model is one line. For each orbit we take the 5th and 95th percentiles of the backscatter history as the dry and wet references. Using percentiles instead of the minimum and maximum makes the references robust to the odd outlier, such as frozen ground or standing water.
LO, HI = 5, 95                           # percentiles of the backscatter record used as dry and wet references

def change_detection(df: pd.DataFrame, by_orbit: bool = True) -> pd.Series:    """Relative soil moisture (%) = (sigma0 - dry) / (wet - dry), references taken per orbit or pooled."""    groups = df.groupby("orbit").vv_db if by_orbit else df.assign(all=1).groupby("all").vv_db    dry = groups.transform(lambda v: np.percentile(v, LO))    wet = groups.transform(lambda v: np.percentile(v, HI))    return (100 * (df.vv_db - dry) / (wet - dry)).clip(0, 100)

for s, df in s1.items(): df["ssm"] = change_detection(df) df["ssm_pooled"] = change_detection(df, by_orbit=False) # for comparison: no incidence angle handling site orbit dry_dB wet_dB sensitivity_dBWIMPL 59 -11.10 -6.18 4.92WIMPL 81 -12.09 -6.69 5.39WIMPL 132 -11.93 -7.36 4.58ROTHD 81 -12.38 -7.23 5.14ROTHD 132 -12.24 -7.32 4.92CARDT 81 -12.94 -10.98 1.96CARDT 132 -12.80 -10.46 2.34CARDT 154 -12.74 -10.84 1.90WADDN 30 -12.79 -10.18 2.61WADDN 81 -13.12 -10.00 3.13WADDN 132 -12.83 -9.17 3.66WADDN 154 -13.12 -9.43 3.69The sensitivity, wet minus dry, is about 5 dB on the arable sites and only 2–4 dB on grassland. A large sensitivity is not automatically good news. On arable land, part of the range comes from crop growth and tillage, not moisture. On grassland, the permanent sward attenuates the soil signal all year, and the range is small, so speckle and noise matter more.
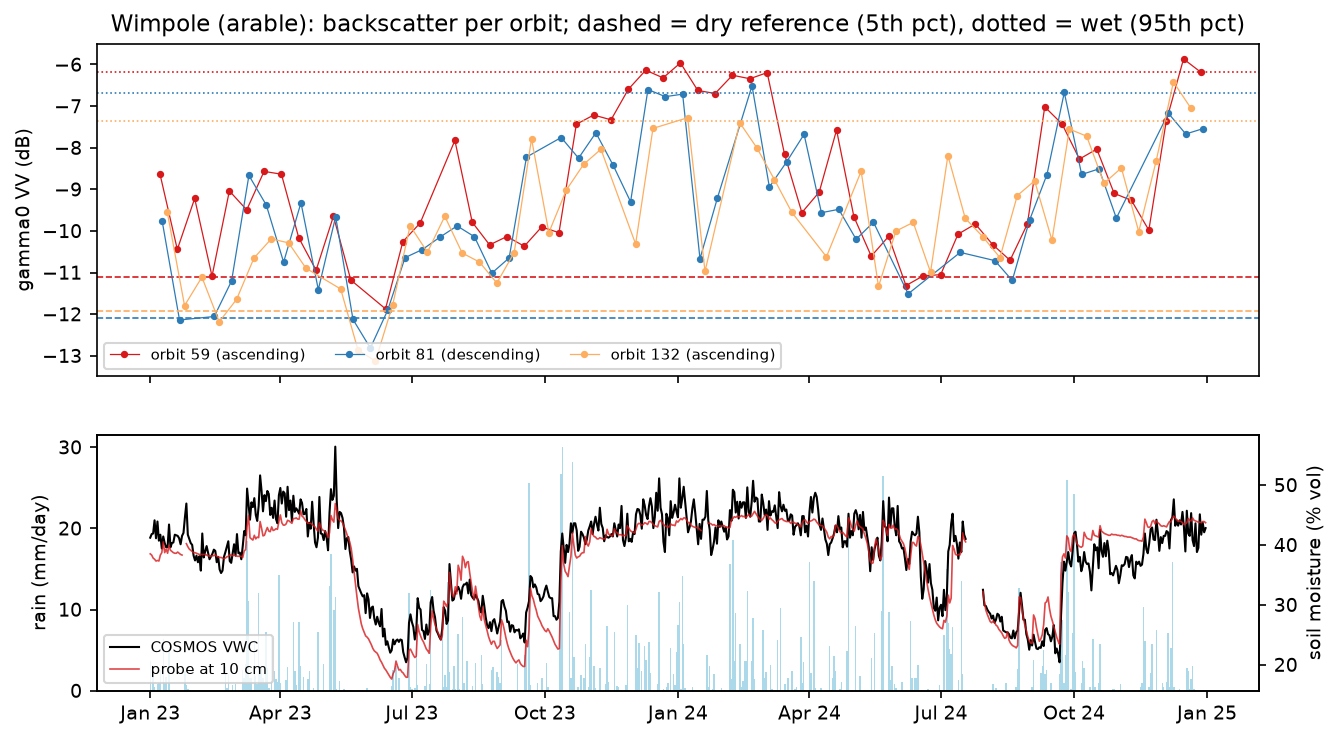
The radar tracks the broad seasonal cycle, but with large swings from one pass to the next. Some of those are real: the top few centimetres wet up within hours of rain and dry out within days, much faster than the soil at 10–30 cm. Others are crop growth, harvest and ploughing.
Step 4: how well does it agree with COSMOS-UK?
We match each Sentinel-1 date with the same day’s COSMOS value and compute Pearson’s r. To see what each modelling choice buys us, we also correlate the raw decibels and the pooled-orbit version, and we split the record into October–March (little vegetation) and April–September (crops and grass growing).
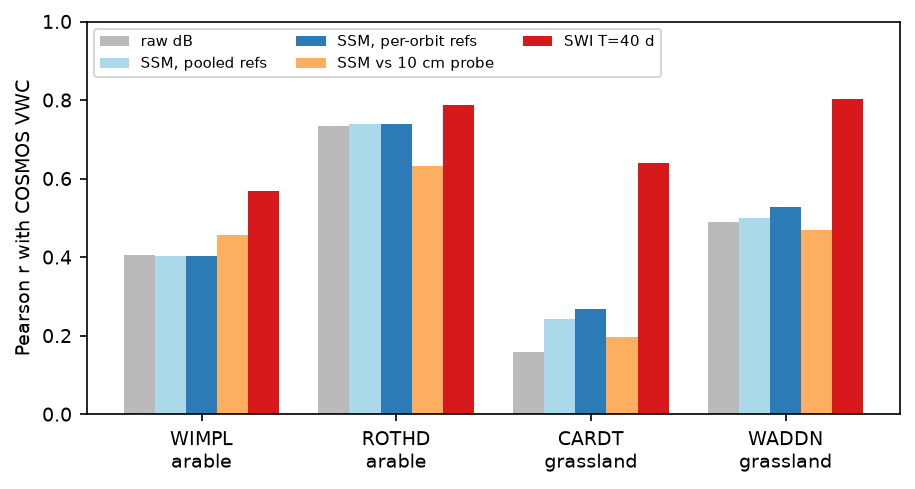
for s, df in s1.items(): m = df.merge(insitu[s], left_on="date", right_index=True, how="inner").dropna(subset=["cosmos_vwc"]) m["rain_3d"] = [insitu[s].precip.loc[d - pd.Timedelta(days=2):d].sum() for d in m.date] winter = m.date.dt.month.isin([10, 11, 12, 1, 2, 3]) rows.append({"site": s, "cover": SITES[s][1], "n": len(m), "r_cosmos": stats.pearsonr(m.ssm, m.cosmos_vwc)[0], "r_pooled_orbits": stats.pearsonr(m.ssm_pooled, m.cosmos_vwc)[0], "r_raw_dB": stats.pearsonr(m.vv_db, m.cosmos_vwc)[0], "r_Oct-Mar": stats.pearsonr(m[winter].ssm, m[winter].cosmos_vwc)[0], "r_Apr-Sep": stats.pearsonr(m[~winter].ssm, m[~winter].cosmos_vwc)[0]}) site cover n r_cosmos r_tdt10cm r_pooled_orbits r_raw_dB r_Oct-Mar r_Apr-Sep rmse_vwc_%WIMPL arable 163 0.40 0.46 0.40 0.41 0.45 0.11 8.45ROTHD arable 104 0.74 0.63 0.74 0.74 0.49 0.71 5.22CARDT grassland 154 0.27 0.20 0.24 0.16 0.41 0.06 8.79WADDN grassland 216 0.53 0.47 0.50 0.49 0.42 0.28 8.41r_pooled_orbits: one dry/wet reference for all orbits (no incidence-angle handling)rmse_vwc_%: relative SSM rescaled to the station's 5th-95th percentile VWC range
mean relative SSM (%) and COSMOS VWC (%) by rain in the previous 3 days: site n_rain>=10mm_3d ssm_after_rain n_no_rain_3d ssm_no_rain cosmos_after_rain cosmos_no_rainWIMPL 32 73.8 43 25.0 41.3 34.5ROTHD 23 73.7 20 33.4 36.8 31.4CARDT 26 65.6 17 27.9 28.4 23.8WADDN 45 71.8 49 36.3 44.1 36.8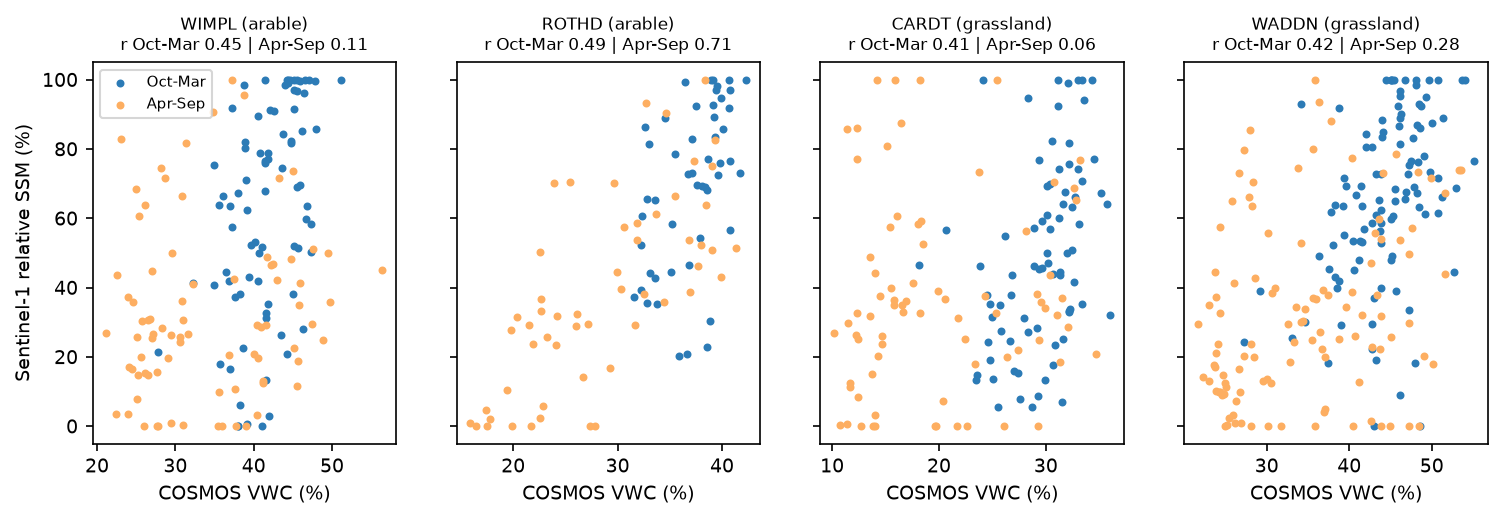
What the numbers say:
- It works, moderately. Same-day r ranged from 0.27 (Cardington) to 0.74 (Rothamsted). That is typical of published C-band validations at single sites, where r = 0.4–0.7 is common.
- The rain response is clear everywhere. After 10 mm or more of rain in three days, relative soil moisture averaged 66–74 %. After three dry days, it averaged 25–36 %. The radar responds to rain much more strongly than COSMOS does, because it sees only the wetted surface.
- Vegetation breaks it in summer. At Wimpole, Cardington and Waddesdon, r fell to 0.06–0.28 in April–September. Rothamsted is the exception (0.71). Its deep summer drying (down to 15 % by volume) dominates the range there, and that drying is large enough to show through the crop.
- Per-orbit references help only a little here. Pooling the orbits changed r by at most 0.03. The angle effect (under 1 dB) is small next to a 5 dB arable range. On grassland, with a 2 dB range, it matters more (0.24 vs 0.27 at Cardington, 0.50 vs 0.53 at Waddesdon). Over hilly ground or with orbits at very different angles, it matters much more.
Step 5: from the surface to the root zone with a soil water index
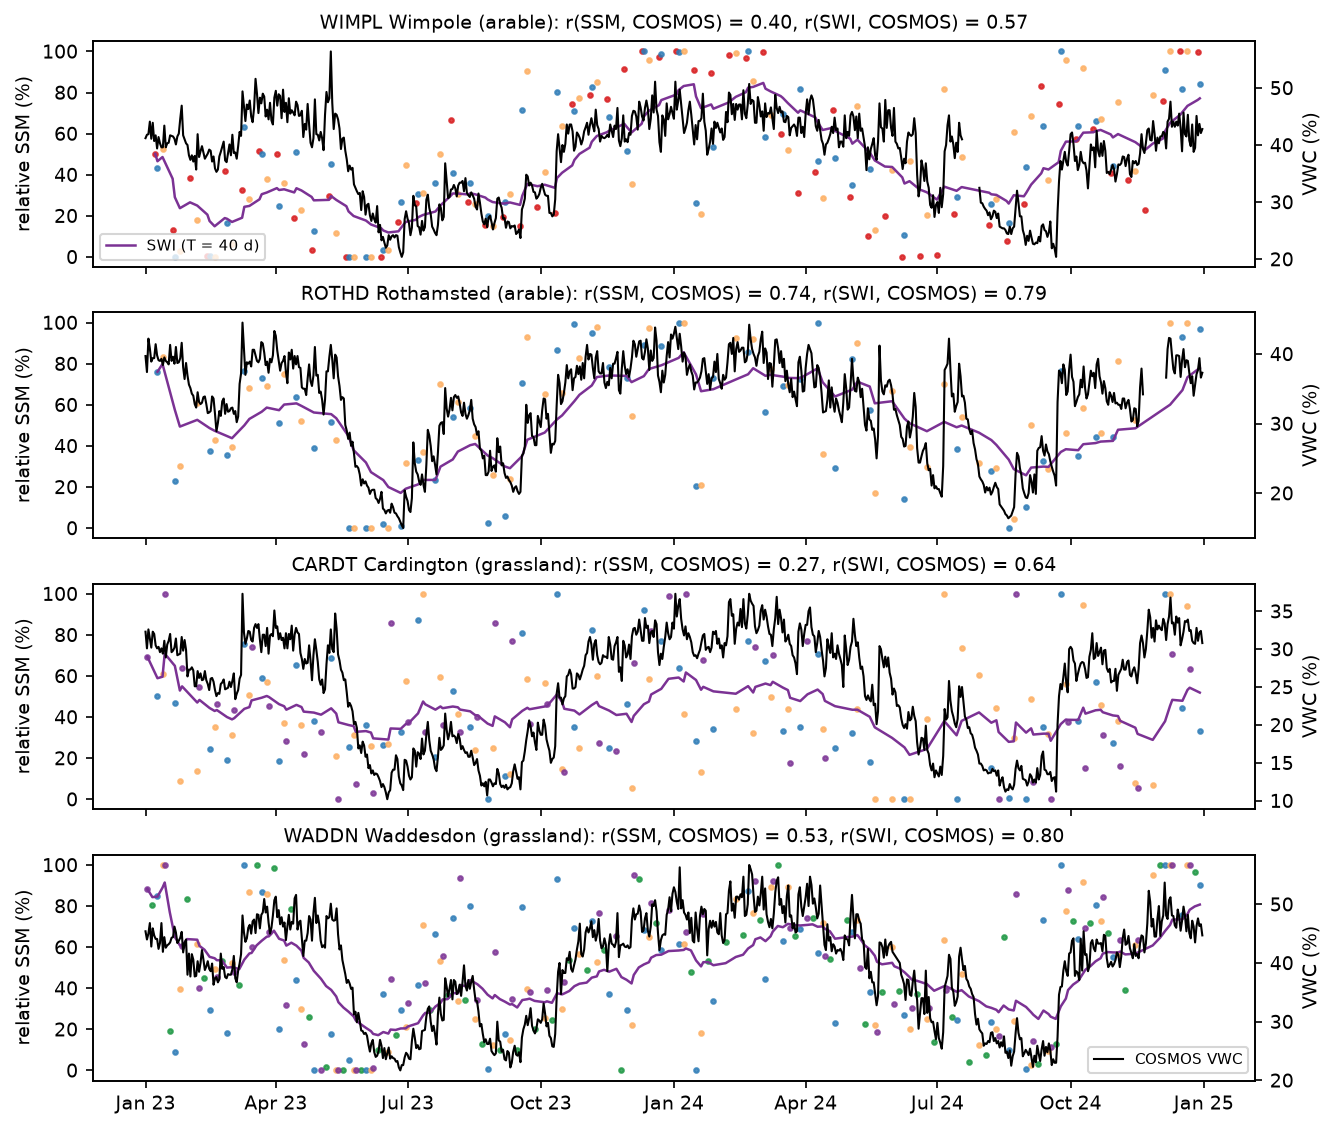
COSMOS integrates the top 10–30 cm, while C-band sees the top 1–5 cm. TU Wien bridges the gap with the soil water index, a recursive exponential filter with a characteristic time T in days. It smooths the surface series and lags it, roughly as infiltration does.
def soil_water_index(times: pd.Series, ssm: pd.Series, t_days: float) -> np.ndarray: """Recursive exponential filter (Albergel et al. 2008): a smoothed, lagged, deeper-layer proxy.""" t = (times - times.iloc[0]).dt.total_seconds().to_numpy() / 86400 swi, gain = np.empty(len(ssm)), 1.0 swi[0] = ssm.iloc[0] for n in range(1, len(ssm)): gain = gain / (gain + np.exp(-(t[n] - t[n - 1]) / t_days)) swi[n] = swi[n - 1] + gain * (ssm.iloc[n] - swi[n - 1]) return swi site cover r_SSM r_SWI_T1 r_SWI_T5 r_SWI_T10 r_SWI_T20 r_SWI_T40 r_SWI_T60WIMPL arable 0.40 0.41 0.47 0.51 0.55 0.57 0.55ROTHD arable 0.74 0.74 0.80 0.84 0.84 0.79 0.73CARDT grassland 0.27 0.28 0.38 0.46 0.55 0.64 0.65WADDN grassland 0.53 0.54 0.66 0.72 0.78 0.80 0.77best characteristic time length on average: T = 40 daysThe soil water index lifts the agreement at every site, to r = 0.57–0.80 at T = 40 days. Rothamsted peaks earlier, at T = 10–20 days. Part of this gain is genuine, because it matches the depths. Part is just averaging away speckle and vegetation noise. Note that we chose T by looking at the in-situ data, so the best value is slightly optimistic.
Step 6: 100 m relative soil moisture maps
To make a map, we apply the same model to every pixel. We read 52 dates of orbit 81 around Wimpole, 12 × 12 km, straight onto a 100 m grid. GDAL’s average resampling in the WarpedVRT averages the 10 × 10 native pixels in linear units, which is a cheap multilook that removes most of the speckle. ESA WorldCover 2021 keeps only grassland and cropland, where the model is meant to work. The map straddles 0° longitude, so it needs two WorldCover tiles.
MAP_ORBIT, MAP_RES, MAP_HALF = 81, 100, 6000map_tr = from_origin(round(cx, -2) - MAP_HALF, round(cy, -2) + MAP_HALF, MAP_RES, MAP_RES)items = list(catalog.search(collections=["sentinel-1-rtc"], bbox=(lon0 - 0.1, lat0 - 0.06, lon0 + 0.1, lat0 + 0.06),                            datetime=f"{START}/{END}", query={"sat:relative_orbit": {"eq": MAP_ORBIT}}).items())with ThreadPoolExecutor(8) as ex:   # GDAL "average" resampling = 10 x 10 multilook in linear units    chips = list(ex.map(lambda i: read_mean(i.assets["vv"].href, map_tr, MW, MW, Resampling.average), items))# ... merge slices by date into `cube` (dates, y, x), in dB ...
dry_ref, wet_ref = np.nanpercentile(cube, LO, axis=0), np.nanpercentile(cube, HI, axis=0)ssm_cube = np.clip(100 * (cube - dry_ref) / (wet_ref - dry_ref), 0, 100)soil = np.isin(wc, [30, 40])            # WorldCover grassland and cropland
We pick three dates using the Wimpole station: the driest day after five rain-free days, the wettest October–March date, and the wettest April–June date, when crops were growing, among the 52 orbit 81 dates.
52 dates on a 120 x 120 grid of 100 m (100.0% valid); grassland+cropland = 87% of pixelsmedian sensitivity (wet - dry) on cropland 7.68 dB, grassland 3.16 dB, tree cover 2.45 dB, built-up 2.64 dB case date COSMOS_vwc_% rain_prev_5d_mm median_SSM_cropland_% median_SSM_grassland_% dry 31 Aug 2024 22.5 0.0 38.2 29.3 wet (winter) 04 Jan 2024 47.8 38.1 95.9 83.9wet (crops growing) 09 May 2023 56.4 51.3 27.4 68.6area-median SSM (grass+crop) vs Wimpole COSMOS over 52 dates: r = 0.37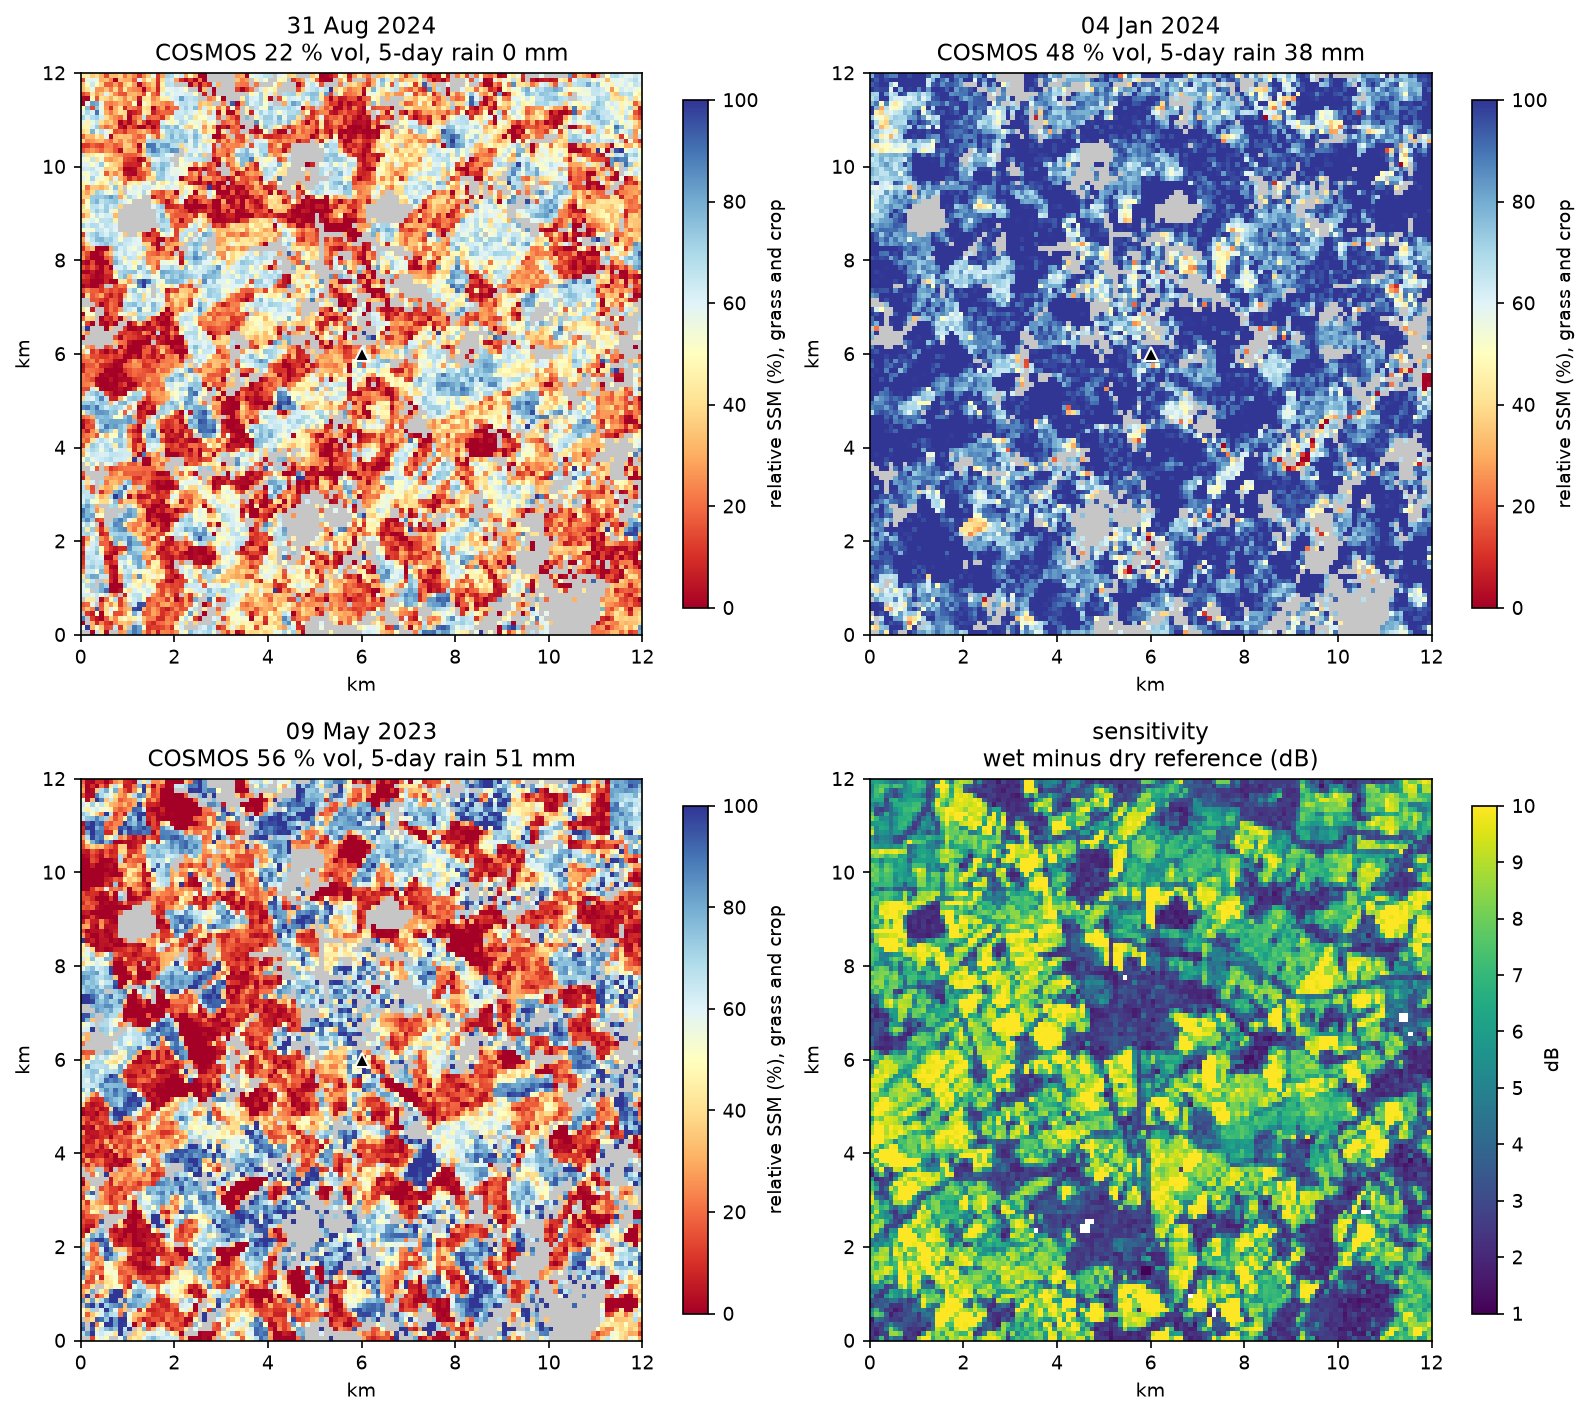
The winter map behaves as expected: after 38 mm of rain, nearly every field is near its wet reference (median 96 % on cropland). The dry map is patchy, because fields differ in crop residue, tillage and stubble. The 9 May 2023 map is the warning. It was the wettest day of the two-year record (56 % by volume), but cropland had a median of only 27 %. In May, winter wheat and oilseed rape are tall, wet canopies that scatter and absorb the radar before it reaches the soil. The sensitivity map shows the other side of the same problem: arable fields have 7–10 dB of range, more than soil moisture alone can produce, because tillage and crop growth add to it.
Limitations and how to improve them
- Vegetation. The biggest error. The operational TU Wien algorithm models the seasonal vegetation effect from the incidence-angle slope. Simpler options are to mask the growing season on arable land, use the VH/VV ratio to flag dense canopy (see Sentinel-1 crop monitoring), or use a water cloud model with Sentinel-2 NDVI.
- Roughness and tillage. Ploughing can shift a field’s backscatter by several decibels in a day. A long record and percentile references dampen this, but a field that is ploughed every autumn will show “wet” ploughed soil.
- Incidence angle. We avoided normalisation by keeping a reference per orbit. Over hills, or to combine orbits into one reference, normalise to a common angle with a per-pixel slope. The RTC collection on the Planetary Computer has no incidence angle band, so you would need the GRD annotation files or a geometry model.
- Depth mismatch. C-band senses 1–5 cm; COSMOS 10–30 cm; the TDT probe a point at 10 cm. Low same-day r is partly a scale problem, not an error in the radar.
- Record length. Two years is short for the references. TU Wien uses the whole Sentinel-1 archive. If 2023–2024 never reached a truly dry or wet state at some pixel, its scale is stretched.
- Speckle. Footprint and 100 m averaging handle it here. For 10–20 m maps, filter first; see SAR speckle filtering in Python.
Frequently asked questions
Can Sentinel-1 measure soil moisture?
Yes, in the top few centimetres and in relative terms. Wet soil has a higher dielectric constant, so it returns more C-band backscatter. Change detection turns that into a 0–100 % index per pixel. Copernicus publishes an operational 1 km surface soil moisture product from Sentinel-1 based on the same TU Wien method. In this tutorial, the same-day correlation with field-scale in-situ sensors was 0.27–0.74, and 0.57–0.80 after filtering into a soil water index.
What is the change detection method for soil moisture?
It scales each backscatter value between a pixel’s own driest and wettest observed values: SSM = (σ⁰ − σ⁰dry) / (σ⁰wet − σ⁰dry). The references come from a long time series, often as low and high percentiles, and the operational version normalises backscatter to a 40° incidence angle first. Because each pixel is compared only with itself, constant effects of soil type and roughness cancel out.
Should I use VV or VH for soil moisture?
VV. Co-polarised backscatter responds more strongly to the soil surface. VH comes mostly from volume scattering in vegetation, so it is more useful as a vegetation indicator, for example to flag dates when the canopy is too dense for a reliable soil moisture estimate.
How deep does Sentinel-1 see into the soil?
C-band (5.6 cm wavelength) penetrates roughly 1–5 cm into moist soil, and a little deeper into very dry soil. That is why the radar reacts within hours to rain that deeper sensors barely notice. To estimate root-zone moisture, use a soil water index or assimilate the observations into a land surface model.
How does vegetation affect SAR soil moisture?
A crop or grass canopy both adds its own backscatter and attenuates the signal from the soil. When the canopy is dense, the radar sees the plants, not the soil. Here, agreement with in-situ soil moisture fell to r = 0.06–0.28 in the growing season at three of four sites, and growing crops made cropland look dry on the wettest day of the record.
Is there a free Sentinel-1 soil moisture product?
Yes. The Copernicus Land Monitoring Service publishes a 1 km Surface Soil Moisture product from Sentinel-1, and a fused soil water index, using the TU Wien change-detection method. For coarser, longer records, ESA CCI Soil Moisture combines many satellites, and reanalyses such as ERA5-Land model soil moisture in layers. Building it yourself, as here, gives you 100 m or finer resolution and full control of the masking.
Next steps
- Learn the radar basics, decibels and the Lee filter in Sentinel-1 SAR flood mapping in Python.
- Flag dense crop canopies with VH and the VH/VV ratio in Sentinel-1 crop monitoring in Python.
- Filter speckle for 10–20 m soil moisture maps with SAR speckle filtering in Python.
- Compare with modelled soil moisture layers from ERA5-Land, opened with xarray as in ERA5 in Python with xarray.
- Use the same “compare with your own history” idea for disasters in earthquake damage mapping with Sentinel-1.
- Run the same model on more COSMOS-UK stations: the API lists over 50, from upland peat to chalk downland.
Data and licences
- Sentinel-1 RTC: contains modified Copernicus Sentinel data 2023–2024, processed by ESA; radiometric terrain correction by Catalyst/Microsoft. Licensed CC BY 4.0. Accessed from the Microsoft Planetary Computer on 23 October 2026.
- COSMOS-UK: daily soil moisture, TDT probe and rainfall data © UK Centre for Ecology & Hydrology, available under the Open Government Licence v3.0. Accessed through the COSMOS-UK API on 23 October 2026.
- ESA WorldCover 2021: © ESA WorldCover project 2021 / contains modified Copernicus Sentinel data (2021) processed by the ESA WorldCover consortium, licensed CC BY 4.0. Accessed from the Microsoft Planetary Computer.
- Code:
soil_moisture.py, tested with Python 3.12.0, pystac-client 0.9.1, planetary-computer 1.0.0, rasterio 1.5.2, numpy 2.5.4, scipy 1.18.1 and pandas 3.1.0.
Key terms
- Change detection (soil moisture)
- The TU Wien approach: scale each new backscatter value between the pixel's own dry and wet references from a long time series, so that 0 % is the driest and 100 % the wettest state observed.
- Relative surface soil moisture (SSM)
- Soil moisture in the top few centimetres as a percentage of the observed range, not in volumetric units. Conversion to m³/m³ needs soil porosity or in-situ data.
- Dry and wet reference
- Low and high percentiles (here the 5th and 95th) of a pixel's backscatter history for one orbit, standing in for completely dry and saturated soil.
- Incidence angle normalisation
- Correcting backscatter to a common viewing angle (40° in the TU Wien products), so that dates seen from different orbits can be compared. Per-orbit references are a simpler alternative.
- COSMOS-UK
- The UK Centre for Ecology & Hydrology's network of cosmic-ray neutron sensors, which measure field-scale soil moisture over about 12 hectares and 10–30 cm depth.
- Soil water index (SWI)
- An exponentially filtered version of a surface soil moisture series, with a characteristic time T in days, used to approximate moisture in deeper soil layers.
Data for this tutorial
- Microsoft Planetary Computer · Sentinel-1 RTC (gamma0 VV) as Cloud Optimised GeoTIFFs via STAC
- ESA WorldCover · 2021 land cover used to keep only grassland and cropland in the maps
- Copernicus Data Space Ecosystem · Sentinel-1 GRD and the operational Copernicus soil moisture products from ESA
Licences and formats for each source are listed in the GIS data sources catalogue.