Earthquake damage mapping with Sentinel-1 in Python: log ratio and z-scores in Antakya
Map earthquake damage from free Sentinel-1 radar in Python. Compute the log ratio and a z-score against a pre-event stack for Antakya after the February 2023 Türkiye earthquakes, aggregate to a 200 m grid, and score the map against 730 destroyed buildings mapped in OpenStreetMap.
- Level
- Intermediate
- Tested with
- Python 3.12
- Source code
- Download scripts
Key takeaways
- A z-score against a stack of 10–11 pre-event images beats the classic two-date log ratio. It ranked 200 m cells with destroyed buildings above the rest with an AUC of 0.84, against 0.75 for the log ratio.
- After the 6 February 2023 earthquakes, 19.6 % of built-up pixels in Antakya changed by more than two standard deviations, against 8.5 % in a no-event control and about 11 % on non-built land.
- With no reference data, an Otsu threshold flagged 261 of 732 built-up cells. It caught 80 % of the cells with mapped destroyed buildings (kappa 0.35), but most flagged cells have no mapped damage.
- Amplitude at 10 m gives a neighbourhood-scale damage proxy, not a building-by-building assessment. Coherence-based methods need SLC data, and the same method found no signal in Myanmar in 2025.
Before you start
- Comfortable with NumPy arrays and GeoPandas; Sentinel-1 SAR flood mapping in Python introduces backscatter, decibels and orbits
- Python 3.10+ with pystac-client, planetary-computer, rasterio, geopandas, pyogrio, numpy, scipy, pandas, requests and matplotlib
- An internet connection: radar is streamed from the Microsoft Planetary Computer and the reference comes from the Humanitarian Data Exchange, with no account or API key
Short answer: to map earthquake damage with Sentinel-1 in Python, compare the first post-event image with the images before the event, on the same orbit.
- The simplest test is the log ratio,
10·log10(post / pre)in decibels. - A more robust test is a z-score against a pre-event stack:
(post − mean_pre) / sd_prefor each pixel. - Mask to built-up land, count the share of pixels with |z| > 2 in grid cells, and threshold that share, for example with Otsu’s method.
For Antakya after the February 2023 earthquakes, this ranked 200 m cells with destroyed buildings with an AUC of 0.84. Read it as a neighbourhood-level damage proxy: 10 m amplitude does not resolve individual buildings.
On 6 February 2023, two earthquakes of magnitude 7.8 and 7.5 struck south-east Türkiye and north-west Syria. More than 50,000 people died. Antakya, the old city of Antioch in Hatay province, was among the worst hit: whole blocks of its old town collapsed. Cloud and smoke did not matter to Sentinel-1, which imaged the city on 9, 10 and 15 February from three different orbits.
In this tutorial, we turn those images into a damage map and, unusually for a tutorial, test it against an independent reference: the 730 destroyed buildings that Humanitarian OpenStreetMap Team (HOT) volunteers mapped in our study area.
You will learn how to:
- stream a pre-event Sentinel-1 stack and the first post-event image for three orbits;
- download a reference of destroyed buildings from the Humanitarian Data Exchange;
- compute the log ratio and a z-score against the pre-event stack, with a no-event control;
- aggregate pixel changes into a 200 m damage index on built-up land;
- measure how well the index ranks damaged cells with ROC AUC;
- pick a threshold without the reference, then build a confusion table and kappa.
All outputs below are real results from damage_mapping.py, run on 23 October 2026 with Python 3.12, pystac-client 0.9.1, rasterio 1.5.2 and geopandas 1.2.0. A full run takes under a minute on a home broadband connection.
How does SAR detect earthquake damage?
A standing building is a strong radar reflector. The wall and the ground form a double-bounce corner that sends the pulse straight back to the satellite, so cities are bright in SAR images. When a building collapses, the corner is destroyed and the rubble scatters the pulse in all directions. Backscatter usually drops. But it can also rise, for example when debris forms new corners, or when a neighbouring building that was in shadow becomes visible. So we look for change in either direction.
There are two families of methods:
- Amplitude (intensity) change, used here. It works with the analysis-ready backscatter that the Planetary Computer serves as Cloud Optimised GeoTIFFs.
- Coherence change, used by the damage proxy maps of NASA JPL/ARIA and the Earth Observatory of Singapore. Interferometric coherence measures whether the fine structure of each pixel stayed the same between two passes. It is more sensitive to damage, but it needs complex single look complex (SLC) data and interferometric processing. See InSAR ground deformation in Python for what that involves.
Step 1: a pre-event stack and the first post-event image
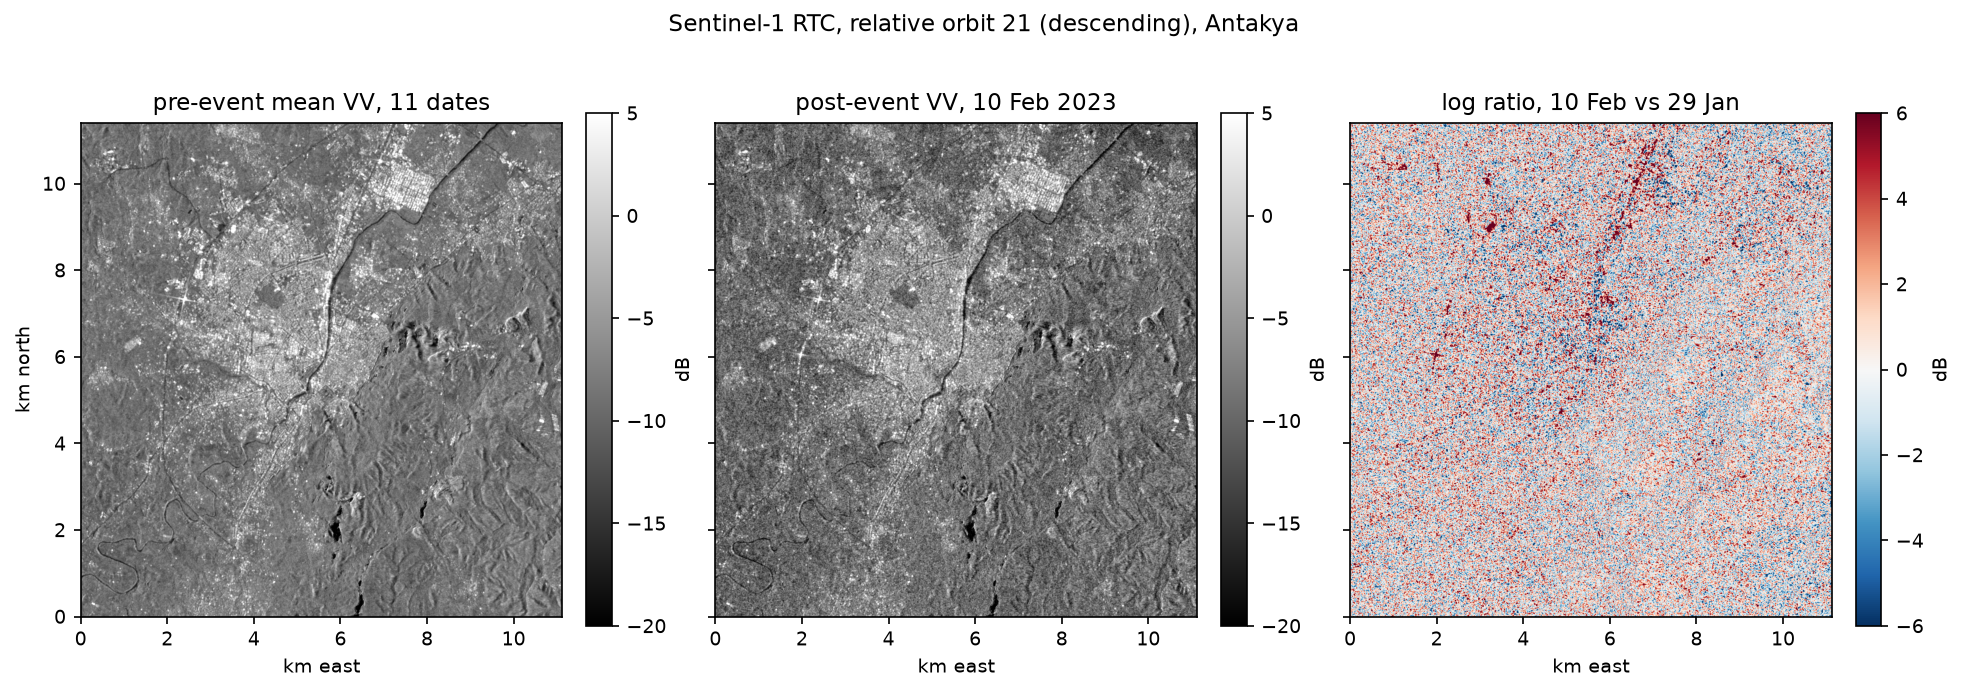
We define a 10 × 11 km box over Antakya and read every Sentinel-1 RTC scene from 1 October 2022 to 19 February 2023, for the three relative orbits that cover the city. Each scene is warped onto one 10 m UTM grid with a WarpedVRT. A pass can be split into two slices that both cover the town, so we merge them by acquisition time.
BBOX = (36.10, 36.15, 36.22, 36.25)        # lon/lat: Antakya (Hatay), TurkeyEVENT = pd.Timestamp("2023-02-06 01:17", tz="UTC")ORBITS = {14: "ascending", 21: "descending", 94: "descending"}CRS = "EPSG:32637"                          # UTM 37Nb = [round(v, -1) for v in transform_bounds(4326, CRS, *BBOX)]TR = from_origin(b[0], b[3], 10, 10)W, H = int((b[2] - b[0]) / 10), int((b[3] - b[1]) / 10)catalog = pystac_client.Client.open("https://planetarycomputer.microsoft.com/api/stac/v1",                                    modifier=planetary_computer.sign_inplace)

def read_band(item, band: str) -> np.ndarray:    """Warp one RTC asset onto the common grid; 0 is nodata in the COGs."""    with rasterio.open(item.assets[band].href) as src, \            WarpedVRT(src, crs=CRS, transform=TR, width=W, height=H, nodata=0,                      resampling=Resampling.bilinear) as vrt:        a = vrt.read(1).astype("float32")    a[a <= 0] = np.nan    return a

def load_orbit(orbit: int) -> dict:    items = list(catalog.search(collections=["sentinel-1-rtc"], bbox=BBOX, datetime="2022-10-01/2023-02-19",                                query={"sat:relative_orbit": {"eq": orbit}}).items())    jobs = [(i, band) for i in items for band in ("vv", "vh")]    with ThreadPoolExecutor(8) as ex:        arrays = list(ex.map(lambda j: read_band(*j), jobs))    by_date = defaultdict(lambda: defaultdict(list))  # several slices can cover the town on one pass    for (item, band), a in zip(jobs, arrays):        by_date[item.datetime.strftime("%Y-%m-%dT%H:%M")][band].append(a)    dates = sorted(by_date)    return {"dates": pd.to_datetime(dates).tz_localize("UTC"),            **{band: np.stack([np.nanmax(np.stack(by_date[d][band]), 0) for d in dates]) for band in ("vv", "vh")}}

s1 = {orbit: load_orbit(orbit) for orbit in ORBITS}grid: 1112 x 1141 pixels of 10 m in EPSG:32637 orbit pass pre_scenes first_pre last_pre post_scenes first_post valid_% 14 ascending 10 12 Oct 2022 28 Jan 2023 1 09 Feb 2023 100.0 21 descending 11 01 Oct 2022 29 Jan 2023 1 10 Feb 2023 100.0 94 descending 11 06 Oct 2022 03 Feb 2023 1 15 Feb 2023 100.0read in 34.4 sEach orbit has 10–11 pre-event images, one every 12 days (Sentinel-1B had failed in December 2021, so only Sentinel-1A was imaging), and one post-event image 3–9 days after the earthquakes. Always compare images from the same orbit: different orbits see buildings from different directions and angles, so their backscatter differs far more than any damage signal.
Step 2: a reference of destroyed buildings
To test a damage map you need an independent reference. The obvious candidates were not usable:
- Copernicus EMS rapid mapping (activation EMSR648) graded buildings in Antakya, but its products for that activation could not be downloaded at the time of writing: the current EMS API lists only activations from EMSR656 onwards, and the old download links return 404.
- UNOSAT published damage points for the event, but the openly downloadable set covers Syrian towns, not Antakya.
So we use the HOT destroyed-buildings export on the Humanitarian Data Exchange. After the earthquakes, OpenStreetMap volunteers tagged buildings that had collapsed, tracing them from very high resolution imagery, including the Copernicus EMS products. The export is open under the ODbL. We find the current GeoPackage link through the HDX API, so the script keeps working if the file is refreshed.
pkg = requests.get("https://data.humdata.org/api/3/action/package_show", params={"id": "hotosm_tur_destroyed_buildings"}, timeout=60).json()["result"]url = next(r["url"] for r in pkg["resources"] if r["url"].endswith(".zip") and "gpkg" in r["url"])with zipfile.ZipFile(io.BytesIO(requests.get(url, timeout=300).content)) as zf: name = next(n for n in zf.namelist() if n.endswith(".gpkg")) REF.write_bytes(zf.read(name))ref = gpd.read_file(REF)print(f"{len(ref)} destroyed-building polygons in Turkey | sources: {ref['source'].value_counts().to_dict()}")ref = ref.to_crs(CRS)ref["geometry"] = ref.geometry.centroidx0, y0 = TR.c, TR.fref = ref[(ref.geometry.x > x0) & (ref.geometry.x < x0 + W * 10) & (ref.geometry.y < y0) & (ref.geometry.y > y0 - H * 10)]3239 destroyed-building polygons in Turkey | sources: {'cscrs': 1542, 'CopernicusEMS': 739, 'microsoft/BuildingFootprints': 115, 'cscrc': 107, 'OpenAerialMap': 31, 'mapillary': 5, 'HGM': 3, 'SkySat': 3, ...}730 of them inside the Antakya study areaWe also need a built-up mask, because damage only happens where there are buildings, and fields and forests change for other reasons. ESA WorldCover 2021 (class 50) gives one: built-up land covers 25.3 % of the box, or 32.1 km².
Step 3: log ratio and z-score against the pre-event stack
The log ratio compares the post-event image with one pre-event image. It is the textbook SAR change detector, but it treats every pixel the same, whether its backscatter normally varies by 0.5 dB or by 4 dB. The z-score divides the change by the pixel’s own pre-event standard deviation, so a 3 dB drop at a stable building counts for more than a 3 dB drop at a pixel that is always noisy.
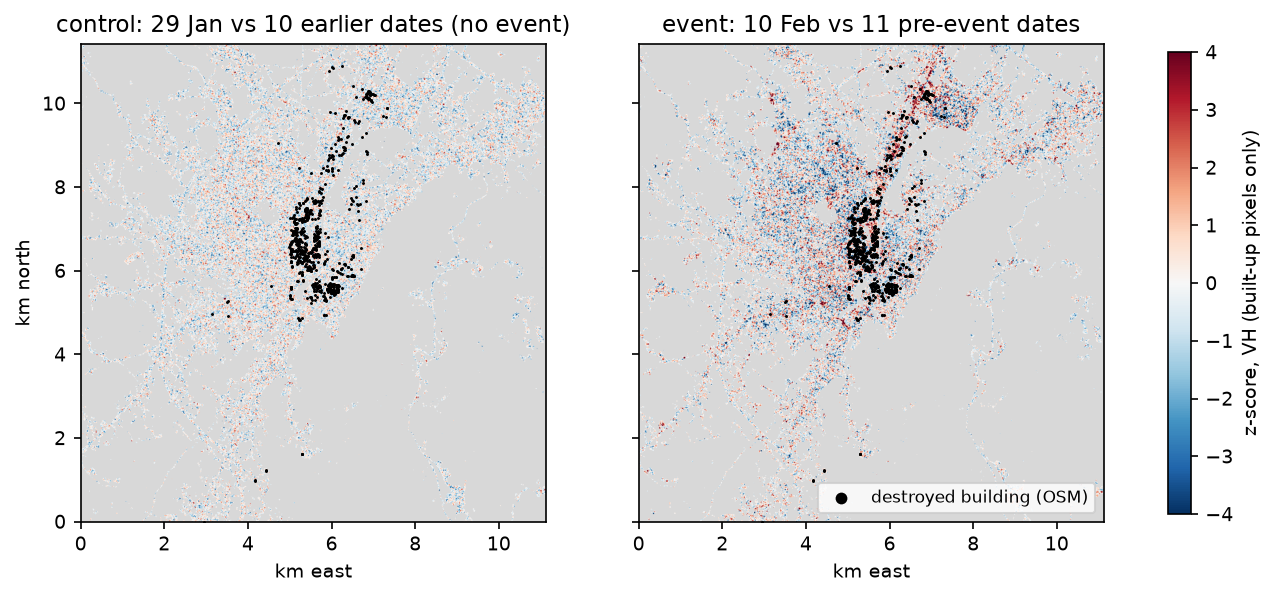
To see what “no earthquake” looks like, we also build a control: the last pre-event image scored against the earlier pre-event images. Any exceedance in the control is the false-alarm background from weather, construction and speckle.
for orbit, d in s1.items(): pre = np.asarray(d["dates"] < EVENT) i_post = int(np.flatnonzero(~pre)[0]) for pol in ("vv", "vh"): db = 10 * np.log10(d[pol]) stack_db, post_db = db[pre], db[i_post] log_ratio = post_db - stack_db[-1] # dB difference = 10 log10(post / pre) mu, sd = stack_db.mean(0), stack_db.std(0, ddof=1) z = (post_db - mu) / sd z_pre = (stack_db[-1] - stack_db[:-1].mean(0)) / stack_db[:-1].std(0, ddof=1) # a no-event control change[(orbit, pol)] = {"log_ratio": log_ratio, "z": z, "z_control": z_pre} orbit pol post built_sd_dB |LR|>3dB_% |z|>2_% |z|>2_%_control 14 VV 09 Feb 1.71 30.2 19.2 8.6 14 VH 09 Feb 1.64 28.3 18.4 9.3 21 VV 10 Feb 1.74 29.7 18.6 7.6 21 VH 10 Feb 1.64 28.9 19.5 8.3 94 VV 15 Feb 1.41 27.3 22.6 9.0 94 VH 15 Feb 1.41 23.5 19.5 8.4
exceedance by WorldCover class (mean of the 6 orbit/polarisation pairs):land cover pixels |z|>2 % event |z|>2 % controltree cover 499947 11.4 8.9 grassland 192410 11.0 8.5 cropland 117546 11.5 8.4 built-up 321099 19.6 8.5The typical built-up pixel varies by 1.4–1.7 dB from date to date, so a 3 dB log ratio threshold flags 24–30 % of built-up pixels: mostly speckle. The z-score is better behaved. In the control, about 8.5 % of pixels exceed |z| = 2 on every land cover class. After the earthquakes, that rose only a little on trees, grass and crops (to about 11 %), but more than doubled on built-up land (19.6 %). That contrast, specific to buildings, is the damage signal.
Step 4: aggregate to a 200 m damage index
Single 10 m pixels are too noisy to call damage. Instead, we count, in each 200 m cell, the share of built-up pixels with |z| > 2, and average that over the 6 orbit and polarisation pairs. We score only cells that are at least half built-up, and we label a cell as damaged in the reference if it contains at least one destroyed building.
def grid_stats(cell_px: int):    h, w = H // cell_px, W // cell_px
    def agg(a):        a = np.where(built, a, np.nan)[:h * cell_px, :w * cell_px].reshape(h, cell_px, w, cell_px)        return np.nanmean(a, axis=(1, 3))
    built_frac = built[:h * cell_px, :w * cell_px].reshape(h, cell_px, w, cell_px).mean(axis=(1, 3))    cols = ((ref.geometry.x - TR.c) / (10 * cell_px)).astype(int).to_numpy()    rws = ((TR.f - ref.geometry.y) / (10 * cell_px)).astype(int).to_numpy()    ok = (rws < h) & (cols < w)    count = np.zeros((h, w))    np.add.at(count, (rws[ok], cols[ok]), 1)    z_index = np.mean([agg((np.abs(c["z"]) > 2).astype("float32")) for c in change.values()], axis=0)    lr_index = np.mean([agg(np.abs(c["log_ratio"])) for c in change.values()], axis=0)    ctrl_index = np.mean([agg((np.abs(c["z_control"]) > 2).astype("float32")) for c in change.values()], axis=0)    per_combo = {k: agg((np.abs(c["z"]) > 2).astype("float32")) for k, c in change.items()}    return built_frac, count, z_index, lr_index, ctrl_index, per_combo

CELL = 20 # 20 x 10 m = 200 mbuilt_frac, count, z_index, lr_index, ctrl_index, per_combo = grid_stats(CELL)sel = built_frac >= 0.5 # score only cells that are at least half built-uplabel = count[sel] >= 1732 cells of 200 m are >= 50 % built-up; 116 contain >= 1 destroyed building (698 of 730 reference buildings fall in scored cells)damage index (mean share of built pixels with |z| > 2 over 6 orbit/polarisation pairs): median 0.200, 95th pct 0.330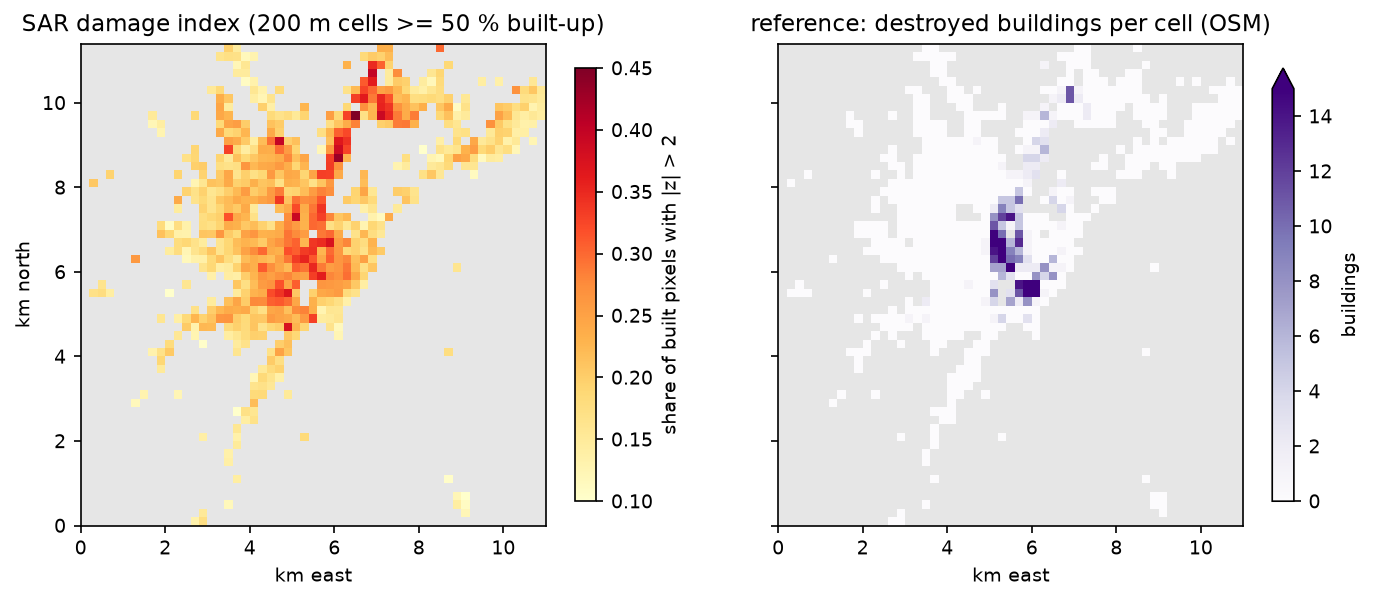
Step 5: does the index rank damaged cells first?
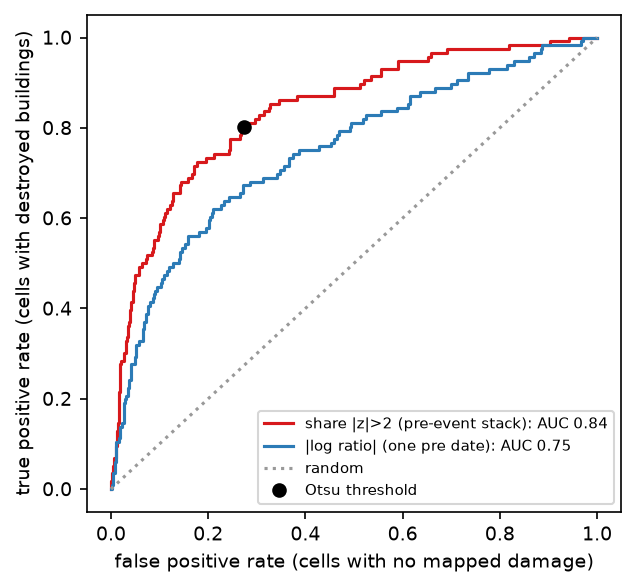
ROC AUC answers a simple question: if you pick one cell with mapped destruction and one without, how often does the damaged cell have the higher score? We compute it with the Mann-Whitney U statistic, so no threshold is needed yet.
def auc(score, label): """ROC AUC via the Mann-Whitney U statistic (probability a damaged cell outranks an undamaged one).""" r = stats.rankdata(score) n1, n0 = label.sum(), (~label).sum() return float((r[label].sum() - n1 * (n1 + 1) / 2) / (n1 * n0)) score AUC |log ratio|, mean of 6 0.749 share |z|>2, mean of 6 0.838share |z|>2, orbit 14 VV 0.790share |z|>2, orbit 14 VH 0.744share |z|>2, orbit 21 VV 0.781share |z|>2, orbit 21 VH 0.791share |z|>2, orbit 94 VV 0.772share |z|>2, orbit 94 VH 0.774Spearman rho (damage index vs number of destroyed buildings per cell) = 0.433, p = 9.3e-35
sensitivity to cell size and reference threshold: cell_m damaged_if_>= cells damaged AUC_logratio AUC_zindex 100 1 3150 242 0.723 0.825 100 3 3150 90 0.717 0.828 200 1 732 116 0.749 0.838 200 3 732 65 0.730 0.845 400 1 175 51 0.757 0.858 400 3 175 38 0.755 0.860Three lessons:
- The pre-event stack helps. The z-index (AUC 0.84) clearly beats the mean absolute log ratio (0.75).
- More looks help. Any single orbit and polarisation reaches 0.74–0.79; averaging all six reaches 0.84. If you have only the first post-event pass, expect the lower figure.
- Coarser cells score better (0.83 at 100 m, 0.86 at 400 m), because more pixels average out speckle. The trade-off is a coarser map.
Step 6: a threshold without the reference, and the agreement table
In a real emergency there is no reference, so the threshold has to come from the data. We compare four rules: the 99th percentile of the no-event control index, Otsu’s method on the event index, and the event mean plus one or two standard deviations. Then we score each with precision, recall, F1, overall accuracy and Cohen’s kappa.
def otsu(values: np.ndarray, bins: int = 64) -> float:    """Otsu's threshold: maximise the between-class variance of a histogram."""    hist, edges = np.histogram(values, bins)    centres = (edges[:-1] + edges[1:]) / 2    best, best_var = centres[0], -1.0    for k in range(1, bins):        w0, w1 = hist[:k].sum(), hist[k:].sum()        if w0 == 0 or w1 == 0:            continue        m0, m1 = (hist[:k] * centres[:k]).sum() / w0, (hist[k:] * centres[k:]).sum() / w1        if w0 * w1 * (m0 - m1) ** 2 > best_var:            best, best_var = centres[k], w0 * w1 * (m0 - m1) ** 2    return float(best)

v = z_index[sel]thresholds = {"control 99th pct": float(np.percentile(ctrl_index[sel], 99)), "Otsu on event index": otsu(v), "event mean + 1 sd": float(v.mean() + v.std()), "event mean + 2 sd": float(v.mean() + 2 * v.std())}rows = [{"rule": k, "threshold": round(t, 3), **agreement(v > t, label)} for k, t in thresholds.items()] rule threshold flagged precision recall f1 overall_accuracy kappa control 99th pct 0.120 712 0.163 1.000 0.280 0.186 0.011Otsu on event index 0.226 261 0.356 0.802 0.493 0.739 0.351 event mean + 1 sd 0.271 111 0.541 0.517 0.529 0.854 0.442 event mean + 2 sd 0.331 34 0.706 0.207 0.320 0.861 0.267
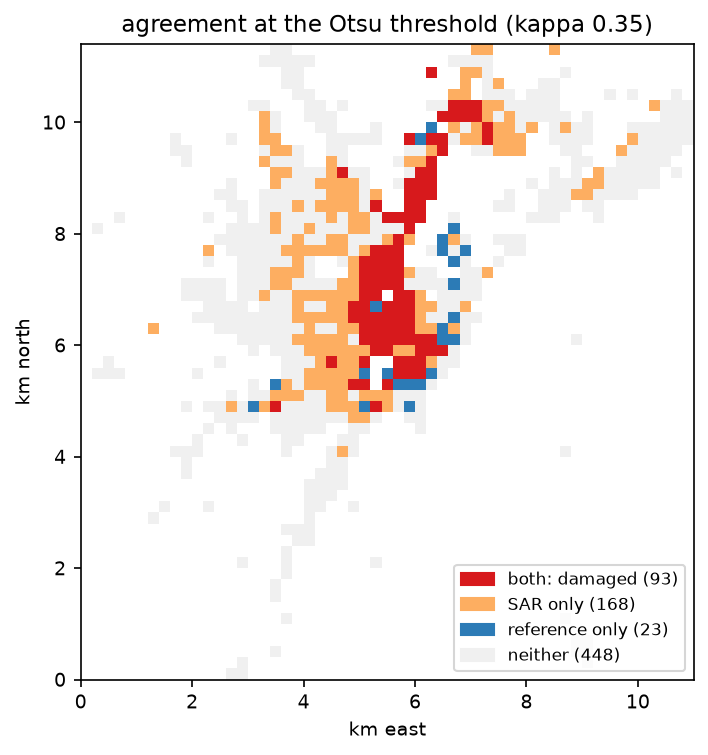
confusion table at the Otsu threshold (0.226), 200 m built-up cells: SAR: damaged SAR: not flagged totalreference: >= 1 destroyed 93 23 116reference: none mapped 168 448 616total 261 471 732odds ratio 10.8; Fisher exact p = 6.9e-27The control threshold is a useful warning. A cell that would be unusual in a normal 12-day interval is everywhere after the earthquake: 712 of 732 cells (97 %) exceed it. The change after the event is city-wide, so “anything unusual” is not a useful definition of damage.
Otsu gives a sensible operating point. It flags 261 cells, catches 93 of the 116 cells with mapped destroyed buildings (recall 0.80), and a flagged cell is 10.8 times more likely, in odds, to contain mapped destruction. Precision is only 0.36, but many of the 168 “SAR only” cells may well be damaged buildings that nobody mapped. A stricter rule (mean + 1 sd) gives the best kappa (0.44) at the cost of missing half the damaged cells. For a first triage map, recall usually matters more.
What can go wrong: weather and other false alarms
Before you trust a single post-event image, check how often normal dates look just as unusual. Here we score every pre-event date against the other pre-event dates, leaving the date out, and plot the share of built-up pixels with |z| > 2, separately for cells with three or more destroyed buildings and cells with none.
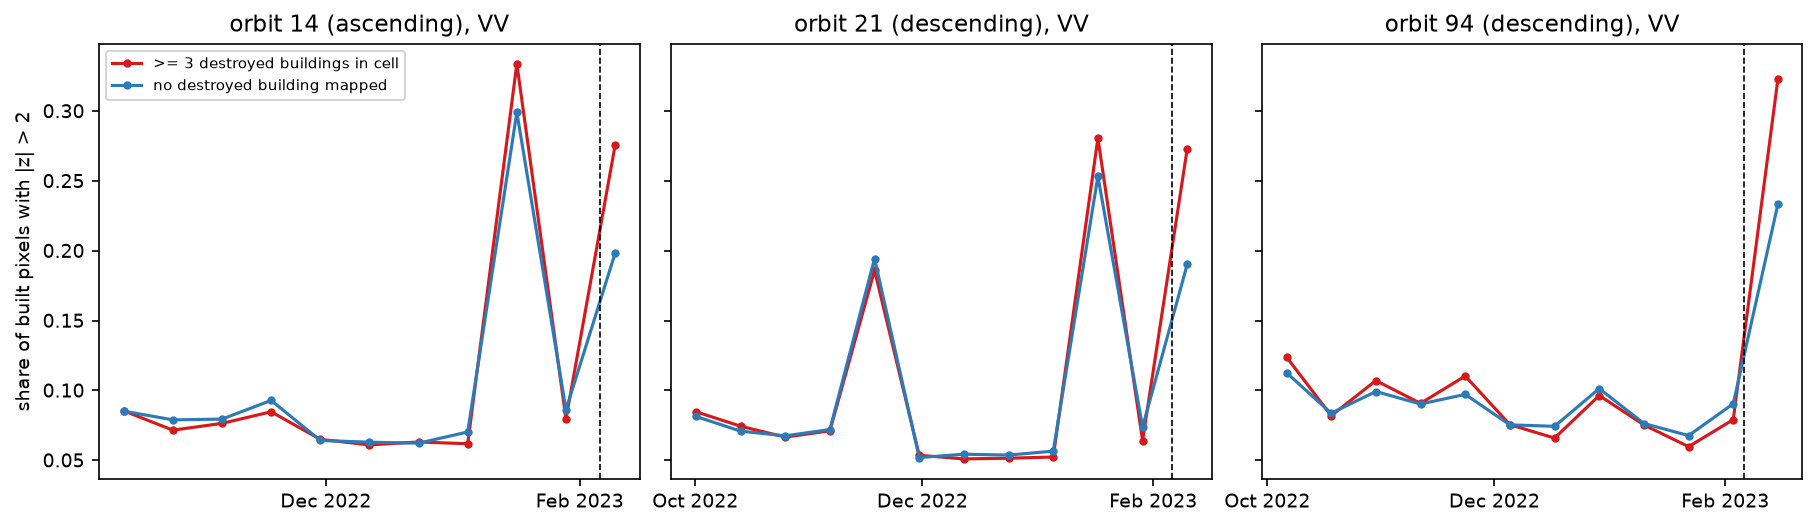
On 16 and 17 January, exceedance jumped to 0.25–0.33 with no earthquake: probably rain or wet snow changing the surfaces of the whole city. What distinguishes the earthquake is not the size of the change but the gap between damaged and undamaged cells. In practice:
- check the weather on the post-event date and use several post-event passes if you can;
- use a robust baseline (median and median absolute deviation) so that one wet date in the stack does not inflate the standard deviation;
- compare with a no-event control, as we did, before setting thresholds.
Limitations and how to improve them
- Resolution. At 10 m, with speckle, one Sentinel-1 pixel covers a whole small building. This method maps damaged neighbourhoods, not damaged buildings. For building-level assessment, use very high resolution optical or SAR imagery, as the Copernicus EMS and UNOSAT analysts do.
- Amplitude only. Coherence loss is the more sensitive damage indicator, but it needs SLC data and interferometric processing. The Earth Observatory of Singapore’s Remote Sensing Lab (EOS-RS) published coherence-based damage proxy maps for this event.
- It does not always work. We tried the same approach for Mandalay and Sagaing after the 28 March 2025 Myanmar earthquake, against UNOSAT damage points, and found no useful signal (AUC about 0.5). We did not establish why; plausible reasons include more scattered damage, smaller buildings and a different mix of partial and total collapse. Test your method against a reference before relying on it.
- Incomplete reference. The HOT export lists only destroyed buildings and is spatially uneven. A graded reference (destroyed, damaged, possibly damaged) such as Copernicus EMS gradings would allow a fairer test.
- Other changes. Rubble clearance, tent camps, displaced vehicles and weather all change backscatter. The first post-event image is the cleanest; later ones mix in the recovery.
- Thresholds. Otsu worked here because damage was widespread. Where damage is rare, the histogram is not bimodal and Otsu will pick an arbitrary split; use a control-based or fixed threshold instead.
Frequently asked questions
Can Sentinel-1 detect earthquake damage?
Yes, at the neighbourhood scale. Collapsed buildings lose the double-bounce reflection that makes cities bright in radar, and the rubble changes backscatter. In Antakya, a 200 m index of unusual change ranked cells with destroyed buildings above the rest with an AUC of 0.84. Sentinel-1 cannot reliably assess individual buildings at 10 m resolution, and it found no clear signal in a test in Myanmar in 2025.
What is log ratio change detection in SAR?
It is the difference between two co-registered SAR images in decibels: 10·log10(post / pre). The ratio is used instead of a difference because SAR speckle is multiplicative, so a ratio gives the same statistics in bright and dark areas. Large positive or negative values mean change. It is simple and fast, but with only one pre-event image it cannot tell real change from a pixel’s normal variability.
Is coherence or amplitude better for damage mapping?
Coherence is usually more sensitive, because even partial damage scrambles the fine phase structure of a pixel. But it needs single look complex (SLC) data, precise co-registration and interferometric processing, and it is affected by vegetation and long time gaps. Amplitude change works with analysis-ready backscatter, such as the Planetary Computer’s RTC, and is easier to run quickly. Many operational products combine both.
How soon after an earthquake can Sentinel-1 map damage?
It depends on when the satellite next passes. With Sentinel-1A alone in 2023, each orbit repeated every 12 days, and Antakya was imaged 3, 4 and 9 days after the earthquakes on three orbits. With Sentinel-1C in orbit since December 2024, revisits are more frequent again. Processing the data with the script in this tutorial takes about a minute.
Why use a z-score instead of a simple difference?
Because pixels vary differently. A building that is stable within 0.5 dB and drops by 3 dB has changed far more than a noisy pixel that swings by 3 dB every 12 days. Dividing by each pixel’s pre-event standard deviation puts every pixel on the same scale. Here that lifted the ranking performance from an AUC of 0.75 for the log ratio to 0.84.
Where can I get reference damage data?
Copernicus EMS rapid mapping, UNOSAT and the Humanitarian Data Exchange publish damage assessments for major disasters, often as building points with damage grades. Availability varies: for this event, the EMS gradings for Antakya could no longer be downloaded, so we used the HOT/OpenStreetMap destroyed-buildings export. Read the methods note of any reference, because coverage is often incomplete.
Next steps
- Learn the radar basics, decibels and speckle filtering in Sentinel-1 SAR flood mapping in Python.
- Improve single-pixel change maps with SAR speckle filtering in Python.
- Measure ground movement from the same earthquake with interferometry: see InSAR ground deformation in Python.
- Map buildings themselves, as a better mask than WorldCover, in building footprints from LiDAR in Python.
- Apply the same “compare with your own history” idea to farmland in Sentinel-1 soil moisture in Python.
Data and licences
- Sentinel-1 RTC: contains modified Copernicus Sentinel data 2022–2023, processed by ESA; radiometric terrain correction by Catalyst/Microsoft. Licensed CC BY 4.0. Accessed from the Microsoft Planetary Computer on 23 October 2026.
- HOT destroyed buildings (Türkiye): © OpenStreetMap contributors, available under the Open Database Licence (ODbL). Exported by the Humanitarian OpenStreetMap Team and accessed from the Humanitarian Data Exchange on 23 October 2026.
- ESA WorldCover 2021: © ESA WorldCover project 2021 / contains modified Copernicus Sentinel data (2021) processed by the ESA WorldCover consortium, licensed CC BY 4.0. Accessed from the Microsoft Planetary Computer.
- Code:
damage_mapping.py, tested with Python 3.12.0, pystac-client 0.9.1, planetary-computer 1.0.0, rasterio 1.5.2, geopandas 1.2.0, numpy 2.5.4, scipy 1.18.1 and pandas 3.1.0.
Key terms
- Log ratio
- The difference of two SAR images in decibels, 10·log10(post / pre). Using a ratio instead of a difference makes the change independent of how bright the pixel was, which suits multiplicative speckle.
- Z-score change detection
- The post-event value minus the pre-event mean, divided by the pre-event standard deviation at the same pixel. It tells you how unusual the change is given that pixel's normal variability.
- Damage proxy map
- A map of where radar backscatter or coherence changed unusually after a disaster, used to prioritise inspection. NASA JPL/ARIA and the Earth Observatory of Singapore produce them from coherence.
- ROC AUC
- The probability that a randomly chosen damaged unit gets a higher score than a randomly chosen undamaged one. 0.5 is no better than random; 1.0 is perfect ranking.
- Otsu threshold
- An automatic threshold that splits a histogram into two classes by maximising the variance between them. It needs no training data.
- Cohen's kappa
- Agreement between two classifications beyond what chance would give. 0 means chance agreement, 1 perfect agreement.
Data for this tutorial
- Microsoft Planetary Computer · Sentinel-1 RTC (gamma0 VV and VH) as Cloud Optimised GeoTIFFs via STAC
- OpenStreetMap · Destroyed buildings mapped by HOT volunteers after the earthquakes, exported to HDX
- ESA WorldCover · 2021 land cover used as the built-up mask
Licences and formats for each source are listed in the GIS data sources catalogue.