Climate and satellite time-series tools
Choose a place or draw an area, pick a dataset and a period, and the service builds a chart or time-lapse from open climate and satellite archives. Results include the underlying data as CSV and can be reused with the credit shown. See the methodology and licences or browse the gallery of examples.
Click the map to choose a location, or type coordinates.
Job
You can leave this page: the job carries on, and the link below returns you to it.
Downloads
Data credit:
Every output carries the line "Generated at TechnicalGIS.com" and the dataset credit. Keep both when you reuse an output; see the output terms.
Gallery
Example outputs generated with these tools. Each can be opened, downloaded and reused with its credit, or used as the starting point for your own request.
-
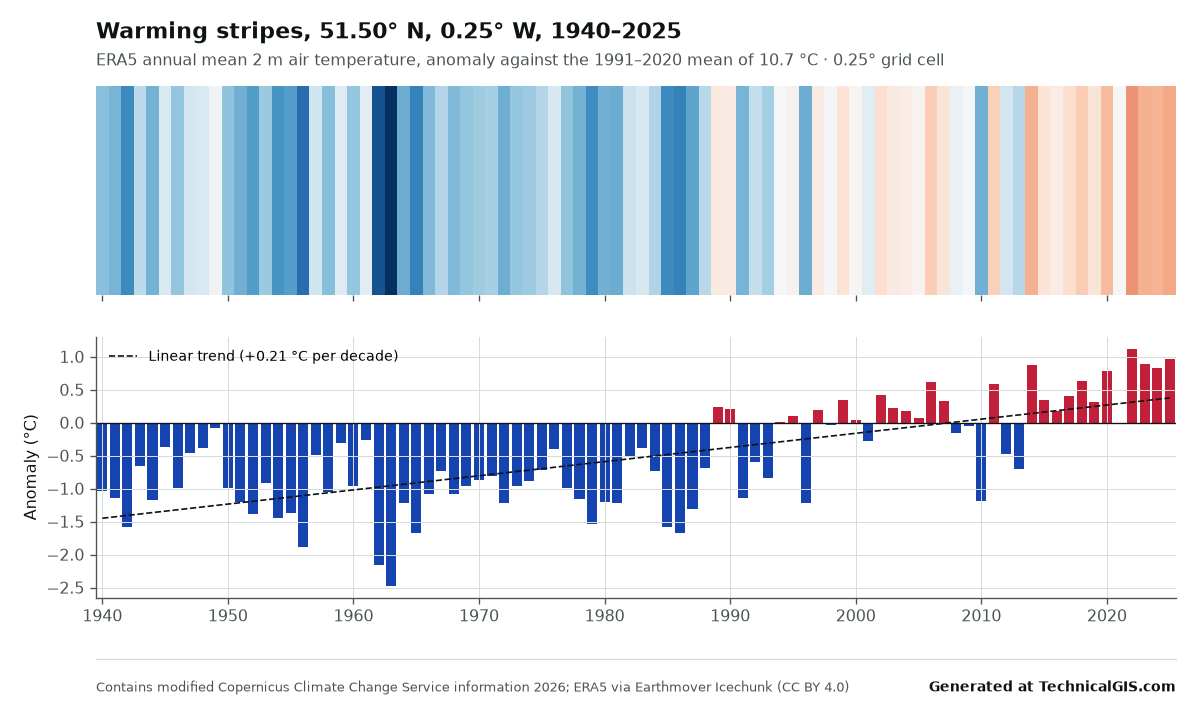 ERA5
Warming stripes for London, 1940 to 2025
Annual mean temperature anomalies for central London from ERA5, drawn as warming stripes against the 1991 to 2020 mean.
-
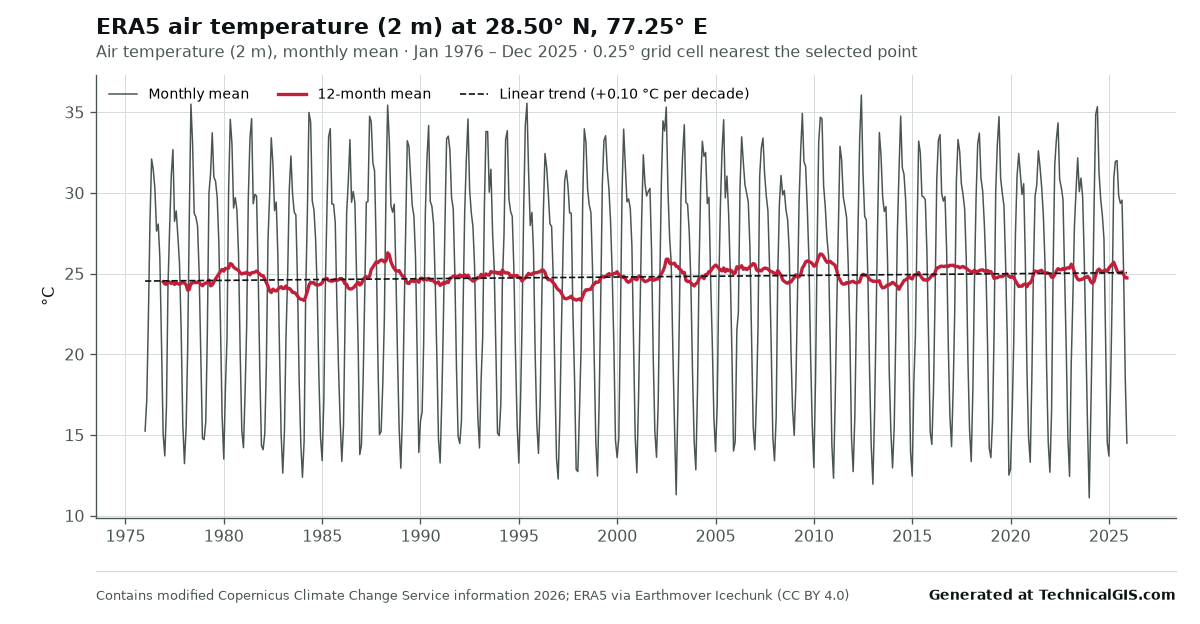 ERA5
Monthly temperature in New Delhi, 1976 to 2025
Fifty years of ERA5 monthly mean air temperature for New Delhi, with a 12-month mean and a deseasonalised linear trend.
-
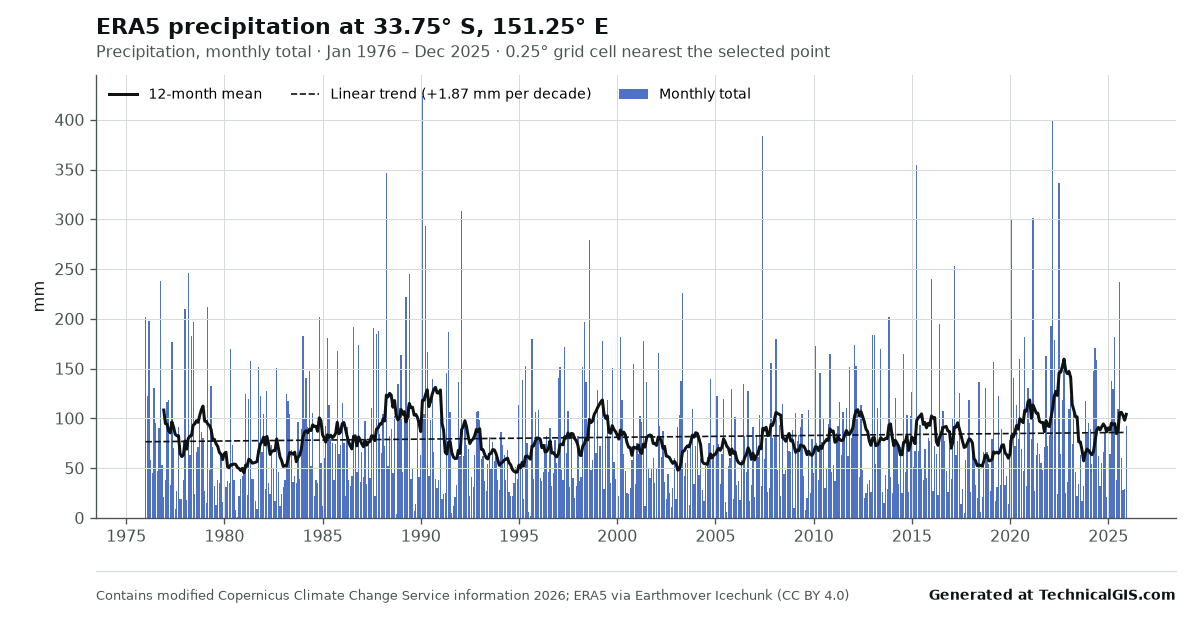 ERA5
Monthly rainfall in Sydney, 1976 to 2025
ERA5 monthly precipitation totals for Sydney over fifty years, with a 12-month mean to show wet and dry phases.
-
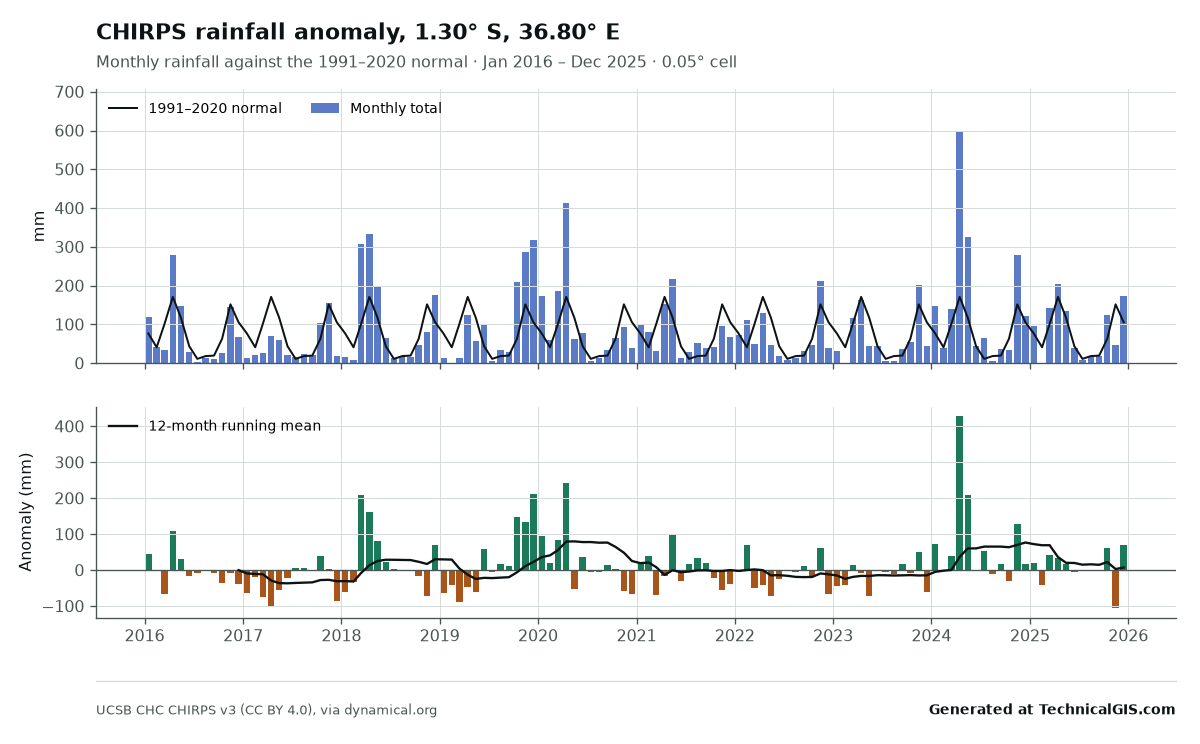 CHIRPS
Rainfall against the normal in Nairobi, 2016 to 2025
CHIRPS monthly rainfall for Nairobi compared with the 1991 to 2020 normal, highlighting the failed and exceptional rainy seasons.
-
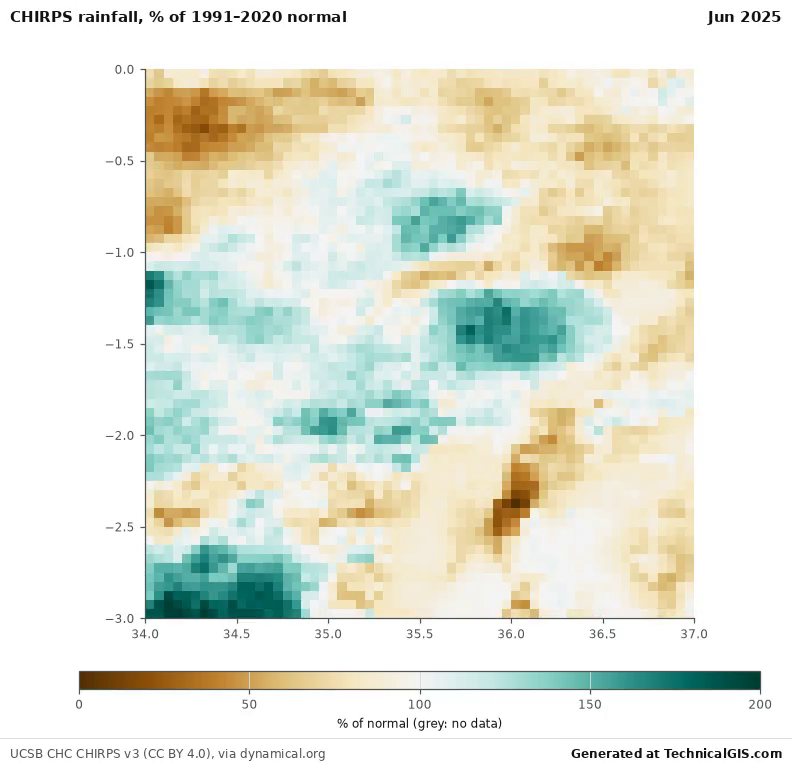 CHIRPS
Rainfall anomaly map, southern Kenya and northern Tanzania, 2023 to 2025
An animated CHIRPS map of monthly rainfall as a percentage of the 1991 to 2020 normal, July 2023 to June 2025.
-
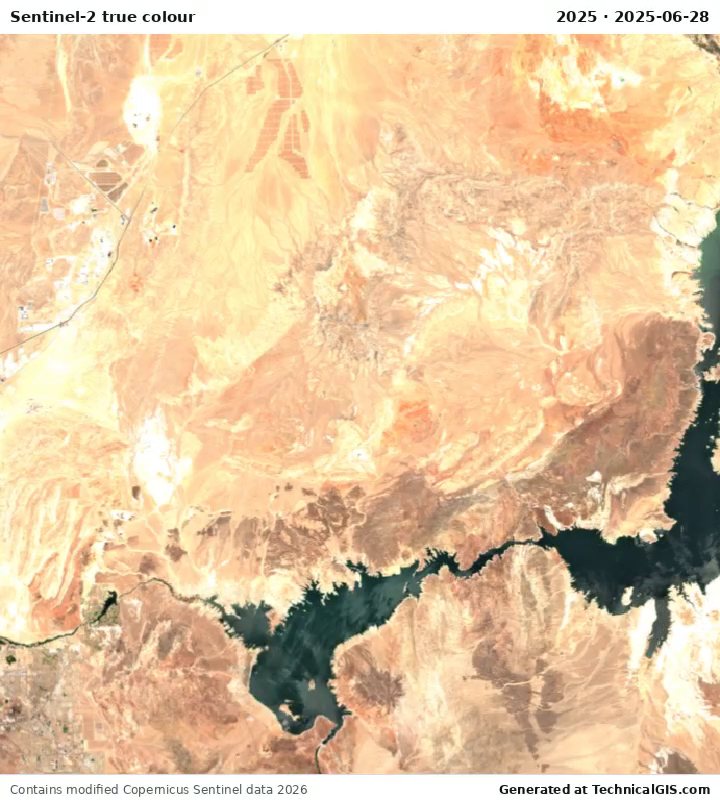 Sentinel-2
Lake Mead from Sentinel-2, 2017 to 2025
Annual cloud-free Sentinel-2 true-colour composites of Lake Mead, showing the reservoir's decline to its 2022 low and partial recovery.
Datasets, licences and limits
The limits keep the shared service responsive for everyone; the form checks them as you go and suggests a coarser setting when a request is too large. Licences were checked on each provider's own pages on 27 October 2026.
| Dataset | Period | Resolution | Outputs and limits | Licence |
|---|---|---|---|---|
| ERA5 reanalysis | 1940 to present | 0.25° grid (about 28 km) | Monthly mean air temperature (2 m): point; up to 50 years; PNG, CSV Monthly total precipitation: point; up to 50 years; PNG, CSV Warming stripes (annual temperature anomaly against 1991–2020): point; up to 87 years; at least 10 years; PNG, CSV | CC BY 4.0 (Earthmover edition); Copernicus licence (CC BY 4.0) for the underlying ERA5 data |
| CHIRPS v3 rainfall | 1981 to present | 0.05° grid (about 5.5 km) | Monthly rainfall and anomaly against 1991–2020: point or area; up to 45 years; area up to 1° across; PNG, CSV Animated monthly rainfall anomaly map: area; up to 3 years; area up to 3° across; MP4, GIF, PNG, CSV | CC BY 4.0 |
| Sentinel-2 L2A imagery | 2017 to present | 10 m native; coarsened to fit the pixel budget | True-colour time-lapse: area; up to 36 frames; area up to 60 km across; up to 1 million pixels per frame; up to 8 million pixel-frames in total; MP4, GIF, PNG, CSV NDVI time-lapse and mean NDVI series: area; up to 24 frames; area up to 60 km across; up to 1 million pixels per frame; up to 8 million pixel-frames in total; MP4, GIF, PNG, CSV | Legal notice on the use of Copernicus Sentinel Data and Service Information |
| Landsat Collection 2 Level-2 | 1984 to present | 30 m native; coarsened to fit the pixel budget | True-colour time-lapse: area; up to 30 frames; area up to 60 km across; up to 1 million pixels per frame; up to 8 million pixel-frames in total; MP4, GIF, PNG, CSV NDVI time-lapse and mean NDVI series: area; up to 24 frames; area up to 60 km across; up to 1 million pixels per frame; up to 8 million pixel-frames in total; MP4, GIF, PNG, CSV | Public domain (U.S. Geological Survey) |
| MODIS vegetation index (MOD13Q1) | 2000 to present | 250 m, 16-day composites | NDVI series (16-day composites): point or area; up to 6 years; area up to 25 km across; PNG, CSV | NASA Earth science data: no restrictions on use (CC0-equivalent) |
How the service works
Requests join a single queue and run one at a time on our own server, so the page shows your position, an estimated start and finish time, the current stage and a progress bar. If the server is busy with other work, the queue pauses briefly to protect performance and resumes automatically. You can cancel a queued or running job at any time, and identical requests made recently are returned straight away from the stored results.
Each output carries the line "Generated at TechnicalGIS.com" together with the dataset's required credit. You may reuse the outputs, including commercially, provided both are kept; the output terms give the details. Results are kept for 7 days.
For larger areas, longer periods, finer resolutions, other datasets or scheduled updates, request bespoke processing.
Frequently asked questions
Is the climate time-series tool free to use?
Yes. Each visitor can run up to 15 requests a day, one at a time, within the limits shown for each dataset. Outputs may be reused, including commercially, provided the "Generated at TechnicalGIS.com" line and the dataset credit are kept.
How long does a request take?
Most charts finish in 10 to 30 seconds and most satellite time-lapses in 30 to 80 seconds once they start. Requests run one at a time in a queue, and the page shows your position, an estimated start and finish time, and the current stage. Every job is stopped after 90 seconds of processing.
Can I close the page while my job runs?
Yes. The job carries on in the queue. Copy the job link, or return to this page in the same browser, to see the progress and download the results, which are kept for 7 days.
What if I need a larger area, a longer period or a finer resolution?
The interactive limits keep the shared service responsive. For larger areas, more frames, other datasets or regular updates, use the "Request bespoke processing" link, which pre-fills the contact form with your request.
Where does the data come from?
ERA5 reanalysis from the Copernicus Climate Change Service, CHIRPS rainfall from the Climate Hazards Center at UC Santa Barbara, Copernicus Sentinel-2 and USGS Landsat imagery, and NASA MODIS vegetation indices. Each dataset is read directly from its open cloud archive, and each was offered only after its licence was confirmed to permit commercial reuse of derived outputs.