3D print a city model with Python: OpenStreetMap buildings on Environment Agency LiDAR
Build a printable model of central Durham from OpenStreetMap footprints and LiDAR heights. Give every building a roof height, or shape the roofs from the surface model, remove detail too thin to print, and prove the city and its two-colour parts are watertight.
- Level
- Advanced
- Tested with
- Python 3.12
- Source code
- Download scripts
Key takeaways
- OpenStreetMap gives the shape of each building and LiDAR gives its height. The 90th percentile of the surface model inside a footprint is a robust roof height.
- Remove what cannot print before you build any meshes. A morphological opening at 0.8 mm (two extrusion lines) kept 91.2 % of the footprint area in central Durham.
- Intersect each footprint prism with a solid made from the LiDAR surface to get vertical walls and real roof shapes. Durham Cathedral's tower went from 29.5 m as a flat block to 66.5 m.
- Every part was proved watertight, and the terrain and buildings parts add up to the whole city, so the two-colour print fits together.
Before you start
- Python 3.10+ with numpy, requests, rasterio, pyproj, shapely, manifold3d, pyvista and matplotlib
- Part 1 of this series, From DEM to 3D-printable STL, or familiarity with building a closed mesh from a height grid
- Some familiarity with LiDAR surface and terrain models; see Working with LiDAR point clouds in Python
- An internet connection for the LiDAR WCS and the Overpass API
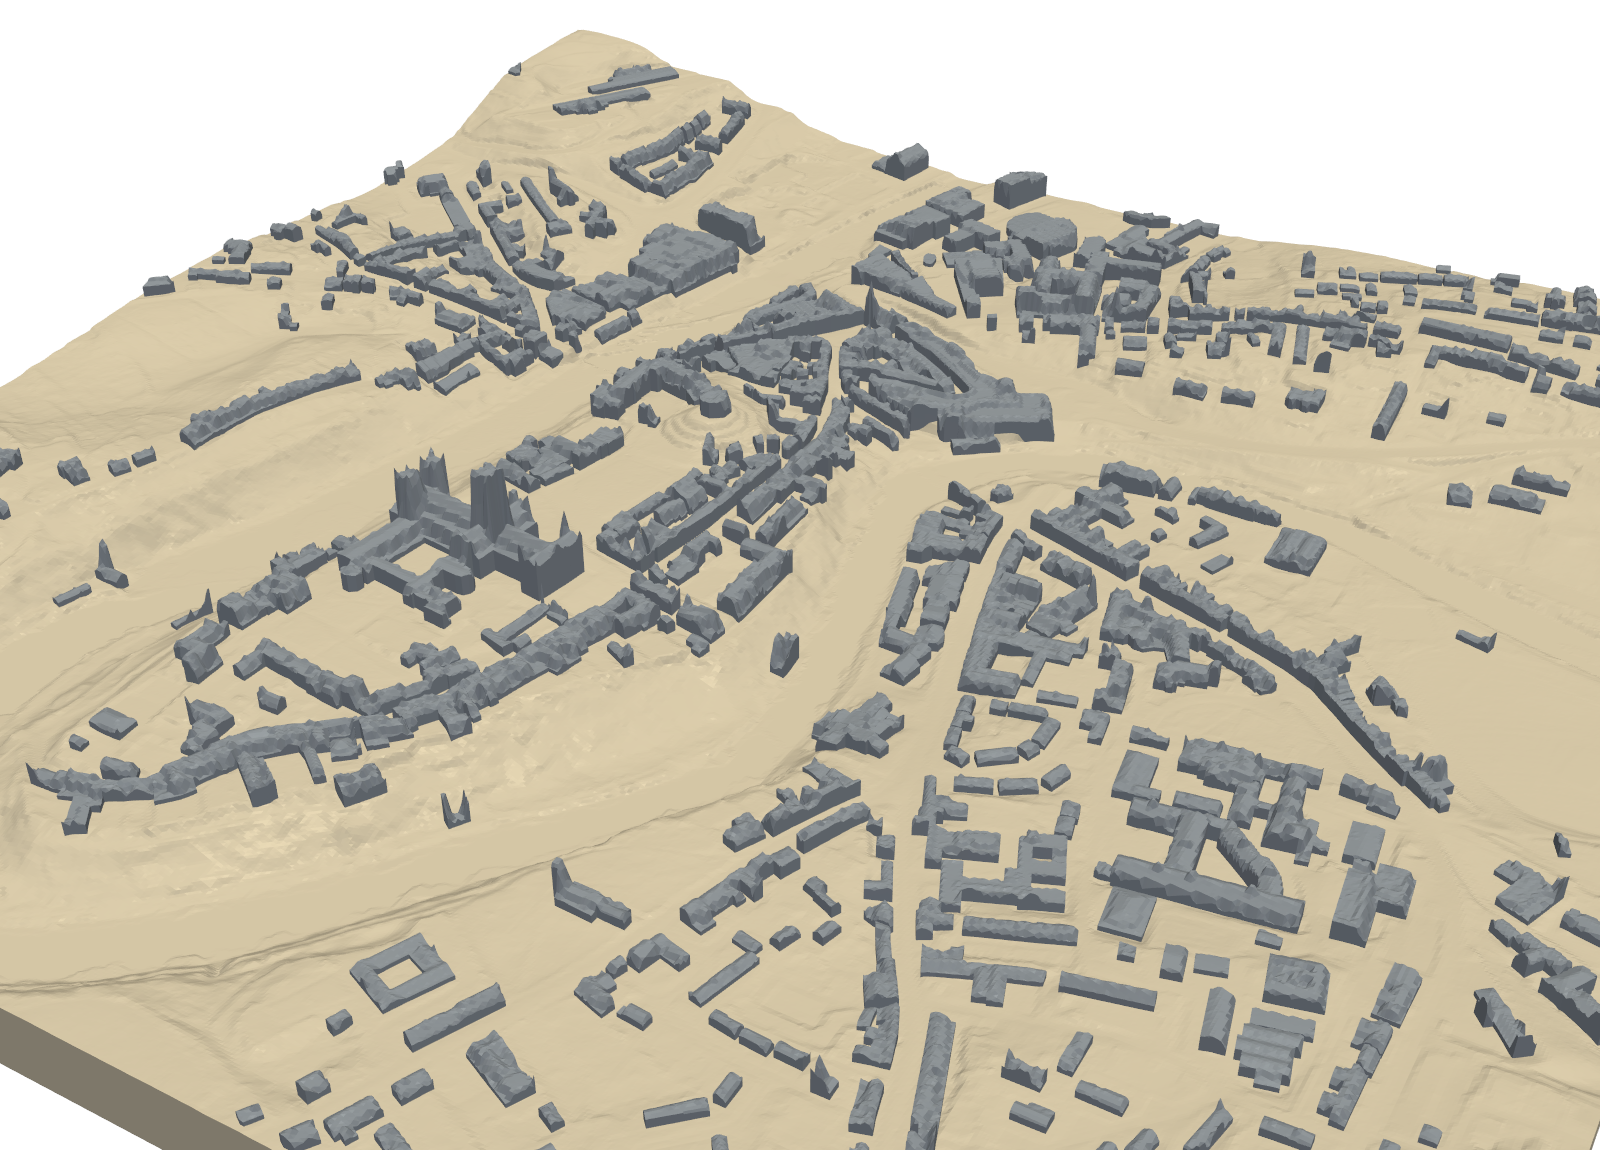
A city model needs two things that rarely come together: the outline of every building and its height. OpenStreetMap has the outlines, drawn by volunteers to a high standard in most British towns. The Environment Agency’s LiDAR has the heights, measured from the air for most of England. This tutorial combines them into a printable model of central Durham: the cathedral and castle on their peninsula in a loop of the River Wear, with the streets, terraces and university buildings around them.
Part 1 of this series, From DEM to 3D-printable STL, built a terrain solid with NumPy. Here we add 1,329 buildings to it with manifold3d, in two styles: simple flat-roofed blocks, and buildings whose roofs follow the LiDAR surface. The steps are:
- fetch the LiDAR terrain (DTM) and surface (DSM) at 1 m;
- download building footprints from OpenStreetMap;
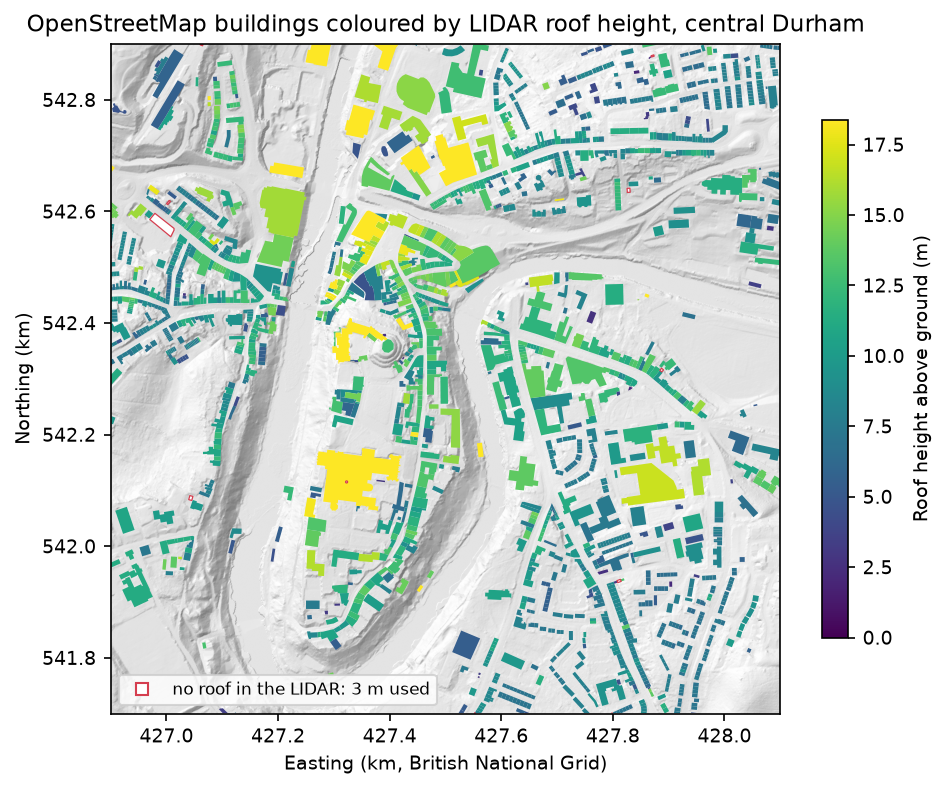
- give every building a height from the LiDAR;
- scale the model and remove detail too thin to print;
- build flat-roofed blocks on the terrain;
- shape the roofs from the LiDAR surface;
- write STLs and a two-colour 3MF.
The full script is city_model.py.
Step 1: LiDAR terrain and surface
The Environment Agency publishes two 1 m LiDAR composites for England through Defra’s Web Coverage Service (WCS): a DTM of the bare ground and a first-return DSM that includes roofs and trees. We fetch both for a 1.2 km square in four 600 m requests each and place the tiles in one array:
AOI = (426_900, 541_700, 428_100, 542_900) # 1.2 x 1.2 km of central Durham, British National Griddtm = mosaic(DTM, "ea_dtm")dsm = mosaic(DSM, "ea_dsm")ndsm = dsm - dtm # height above the ground: buildings, trees, bridges=== Step 1: Environment Agency LIDAR DTM and DSM at 1 m ===DTM 1200 x 1200 cells | no-data 0 | 26.9 - 90.8 mDSM 1200 x 1200 cells | no-data 0 | 26.9 - 130.9 mDSM - DTM: median 2.93 m | 99th percentile 25.6 m | below -0.5 m: 0.02 % of cellsThe two surveys line up well. Only 0.02 % of cells have the surface more than half a metre below the ground, which would be impossible if both were from the same flight. The highest DSM value, 130.9 m, is the top of the cathedral’s central tower.
Step 2: building footprints from OpenStreetMap
The Overpass API returns every way and relation tagged building in a box, with its geometry. We convert the AOI to latitude and longitude for the query, then project the results back to British National Grid. Buildings mapped as multipolygon relations, such as those with courtyards, have their outer rings joined and their inner rings cut out.
query = f'[out:json][timeout:120];(way["building"]({bbox});relation["building"]({bbox}););out geom;'r = requests.post(endpoint, data={"data": query}, headers=UA, timeout=200)=== Step 2: OpenStreetMap building footprints ===Overpass: 1,832 elements -> 1,814 footprints inside the model area (9 multipolygons)tagged: height 4 | building:levels 107footprint area: total 28.6 ha | median 66 m2Only 4 of the 1,814 buildings have a height tag and 107 have building:levels. That is typical: OpenStreetMap is good at outlines and patchy on heights, which is why we take heights from the LiDAR.
Step 3: a roof height for every building
We burn the footprints into a 1 m grid aligned with the LiDAR, with each building’s number in its cells, using rasterio.features.rasterize. Then, for each building, we take the cells inside it:
b["ground"] = float(np.median(ground[ok]))h = float(np.percentile(surface[ok], 90)) - b["ground"] # 90th percentile: the roof, not the eavesif h < MIN_HEIGHT_M: h, b["source"] = FALLBACK_M, "fallback"The 90th percentile of the surface is close to the ridge of a pitched roof. It is also not thrown by a single high point, such as a chimney or the edge of a tree. Ground height is the median of the DTM under the footprint, which suits buildings on a slope.
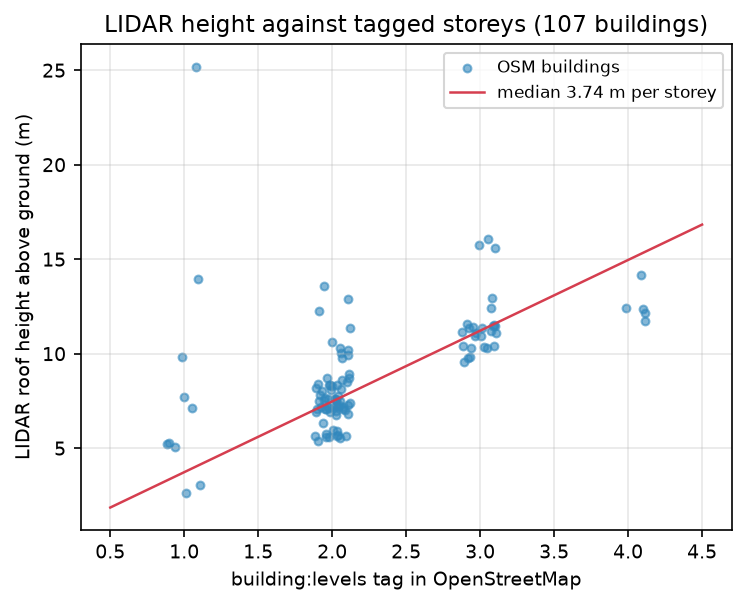
=== Step 3: a roof height for every building from the LIDAR ===LIDAR roof heights for 1,800 buildings: median 8.6 m | 90th percentile 13.4 m | max 29.5 mtoo small to hold a 1 m cell: 5 | no roof in the LIDAR (< 2 m): 9 -> 3 mtallest: Durham Cathedral 29.5 m above ground (427,339 E 542,127 N)buildings with building:levels and a LIDAR height: 107 | LIDAR height per storey: median 3.74 m (interquartile 3.46 - 4.23 m)Nine buildings had no roof in the LiDAR, most likely because they were built after the survey, or are open structures. They get a single storey of 3 m. The cathedral’s height of 29.5 m is its nave roof: one number for the whole building cannot include its towers. Step 6 fixes that.
As a sanity check, we compare LiDAR heights with the 107 buildings tagged with a number of storeys. The median is 3.74 m per storey. That is plausible for older buildings with pitched roofs, since the height includes the roof as well as the floors. A few one-storey buildings stand at 10 m or more. These may be tall single halls, buildings under trees, or mistakes in the tag. A check like this is a quick way to find them.
Step 4: scale and printable footprints
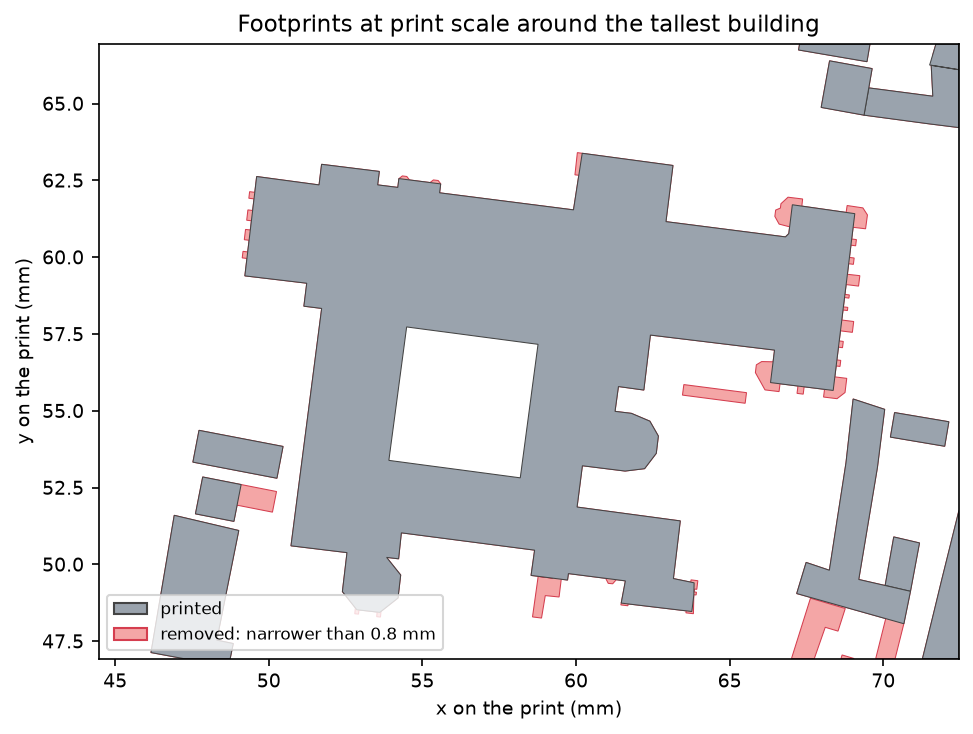
A 160 mm model of 1.2 km gives a scale of 1:7,488. Buildings and hills stay at true scale, so the cathedral tower and the 64 m drop from the hills to the river are in proportion. At this scale a 0.8 mm wall, two lines of a 0.4 mm nozzle, is 6 m on the ground. Narrow alleys, thin extensions and small sheds will not print, so we remove them now, while they are still 2D shapes:
footprints = [to_mm(b["geom"]).simplify(SIMPLIFY_MM) for b in buildings]blocks = unary_union(footprints) # terraces and joined buildings become one blockr = MIN_FEATURE_MM / 2printable = blocks.buffer(-r, join_style="mitre").buffer(r, join_style="mitre")That is a morphological opening: shrink every shape by 0.4 mm and grow it back. Anything narrower than 0.8 mm disappears, and everything else returns to its original outline. We open the merged blocks rather than each building. A terraced house is often only 5 m wide, 0.7 mm on the print, and would vanish on its own, but as part of the terrace it prints. Each building then keeps its own outline and height, clipped to the printable area.
=== Step 4: scale and printable footprints ===terrain 600 x 600 cells of 2 m | scale 1:7,488 | cell 0.267 mmmodel 160.0 x 160.0 mm | terrain 3.0 - 11.5 mm high | 0.8 mm on the print = 6.0 m on the groundblocks after merging touching footprints: 689printable: 1,329 of 1,814 buildings kept | footprint area 4,648 of 5,094 mm2 (91.2 %)We lose 485 buildings but only 8.8 % of the footprint area: the buildings that go are small sheds, garages and slivers.
Step 5: flat-roofed blocks
Each footprint becomes a prism from 1 mm above the bottom of the model, inside the solid base, up to its roof height. Starting low means every building is sunk into the terrain, however steep the slope, so there is never a gap under a wall:
def prism(poly, top):    p = orient(poly, 1.0)    cs = mf.CrossSection([np.array(p.exterior.coords)[:-1]] + [np.array(h.coords)[:-1] for h in p.interiors])    return mf.Manifold.extrude(cs, top - 1.0).translate((0, 0, 1.0))
flat = mf.Manifold.batch_boolean([prism(p, BASE_MM + (b["ground"] + b["height"] - zmin) * scale * Z_EXAGGERATION)                                  for b in kept for p in b["mm"].geoms], mf.OpType.Add)city_flat = terrain + flat
batch_boolean unions all 1,333 prisms in one call. Overlapping and touching buildings merge cleanly into single blocks.
=== Step 5: flat-roofed blocks on the terrain ===terrain 1,439,996 triangles | watertight True | oriented True | volume 152.54 cm3flat city 1,465,354 triangles | watertight True | oriented True | volume 160.14 cm3[1,333 prisms, booleans and checks: 1.6 s]Step 6: roofs shaped by the LiDAR
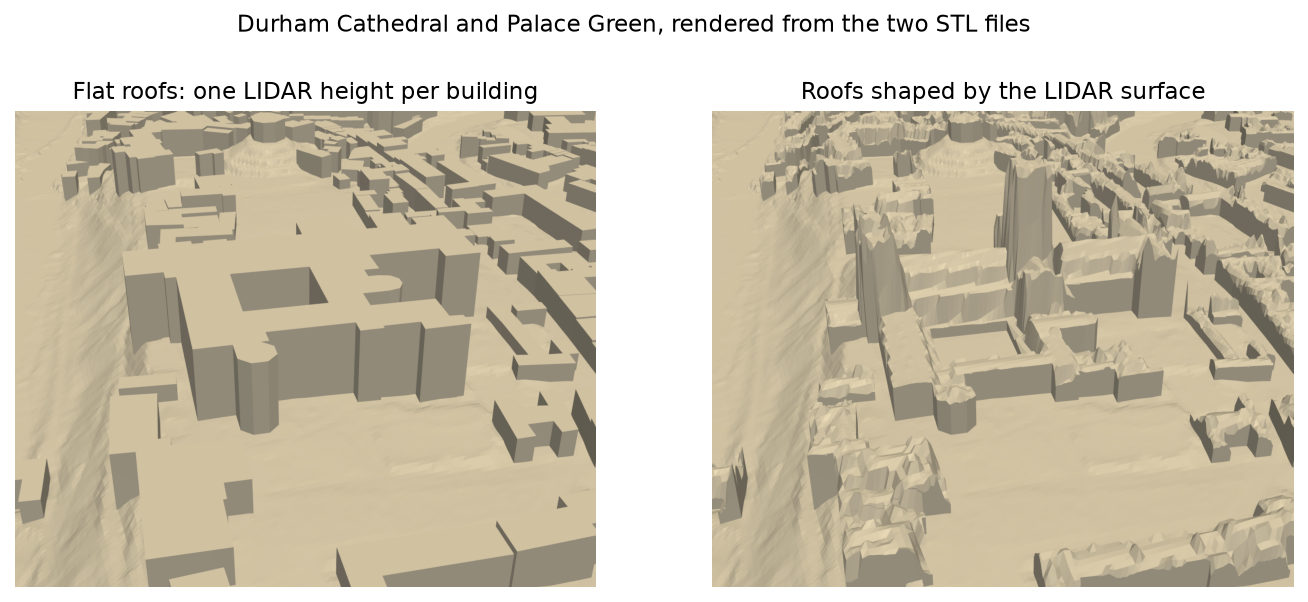
Flat roofs are clean and print well, but they lose towers, spires and pitched roofs. To keep them, we turn the surface model into a second solid. Then we intersect it with tall prisms of the same footprints. The walls come from OpenStreetMap and stay vertical; the roofs follow the LiDAR:
dsm2 = dsm.reshape(rows, k, cols, k).max(axis=(1, 3)) # block maximum keeps roof edges at roof heightroof_m = np.maximum(dsm2, dem + FALLBACK_M) # every building at least one storey highZr = BASE_MM + (roof_m - zmin) * scale * Z_EXAGGERATIONsurface = to_manifold(*heightfield_solid(Zr, cell_mm))tall = mf.Manifold.batch_boolean([prism(p, Zr.max() + 1) for b in kept for p in b["mm"].geoms], mf.OpType.Add)shaped = tall ^ surface # vertical walls from OSM, roof shape from the DSMcity = terrain + shapedroofs = shaped - terrain # the part of each building above the groundWe take the maximum of each 2 × 2 block of the 1 m DSM, not the mean. Otherwise a cell on the edge of a roof would average roof with pavement, and the edges would droop.
=== Step 6: roofs shaped by the LIDAR surface ===city 1,709,826 triangles | watertight True | oriented True | volume 158.67 cm3buildings 528,520 triangles | watertight True | oriented True | volume 6.13 cm3[booleans and checks: 2.4 s]terrain + buildings = 158.669 cm3 | city = 158.669 cm3 | overlap between the two parts 0.0002 mm3buildings part: 588 separate pieces | smallest 0.541 mm3 | largest 425.6 mm3 | top of the model 16.9 mmDurham Cathedral: flat roof 29.5 m | LIDAR roof up to 66.5 m above its median groundThe cathedral’s central tower is now 66.5 m above the ground, close to its published height of about 66 m, and the two western towers appear too. Both new solids are watertight and oriented. The terrain and the buildings part add up to the whole city, and their overlap of 0.0002 mm³ is rounding, so the two parts of a two-colour print will fit together. The buildings part has 588 separate pieces, each a connected block of buildings, all sitting on the terrain.
Step 7: STLs and a 3MF
=== Step 7: write STL and 3MF ===durham_city_flat_roofs.stl 73.3 MB | 1,465,354 facets | 84 + 50 x facets = file size: Truedurham_city.stl 85.5 MB | 1,709,826 facets | 84 + 50 x facets = file size: Truedurham_terrain.stl 72.0 MB | 1,439,996 facets | 84 + 50 x facets = file size: Truedurham_buildings.stl 26.4 MB | 528,520 facets | 84 + 50 x facets = file size: Truedurham_two_colour.3mf 18.0 MB | parts: terrain, buildingsPrint durham_city_flat_roofs.stl or durham_city.stl in one colour. For two colours, open durham_two_colour.3mf: it holds the terrain and the buildings as two named parts in place, ready to assign to two filaments. The colour change happens at a different height for each building, so this needs a multi-material printer rather than a filament swap at one layer.
Printing tips
- Layer height: 0.12 to 0.16 mm. A two-storey house is under 1 mm tall at this scale, so finer layers make the difference between a block and a building.
- Walls: check that the slicer’s minimum wall width is not above 0.8 mm, or it will drop the narrowest blocks we deliberately kept.
- Seams: with hundreds of small blocks, the slicer’s “aligned” or “rear” seam position keeps the start of each loop off the visible faces.
- Light grey or white shows buildings and their shadows best. Dark filaments hide the detail.
Limitations
- Trees. The first-return DSM records tree canopy as well as roofs. Where trees overhang a building, its LiDAR roof is too high and rough, as on some buildings around Palace Green. Flat roofs from the 90th percentile are less affected.
- Survey dates differ. The LiDAR composite and OpenStreetMap were captured at different times. New buildings may have no roof in the LiDAR, and demolished ones may still be in the surface.
- Bridges and walls. Bridges, viaducts and free-standing walls are usually not mapped as buildings, so they are not in the model, though the terrain shows the valleys they cross.
- LiDAR coverage is England only. For Wales, Natural Resources Wales publishes LiDAR under the Open Government Licence, and Scotland has the Scottish Remote Sensing Portal. Elsewhere, use OSM
heightandbuilding:levelstags with a default; the rest of the code is unchanged.
Frequently asked questions
How do I 3D print my town from OpenStreetMap?
Download the building footprints for your area with the Overpass API, give each a height, and extrude them on a terrain model. Remove features thinner than two nozzle widths before you build meshes. Then check that the result is watertight. This tutorial does all of that in Python with shapely and manifold3d.
Where do building heights come from?
In England, the best open source is LiDAR: the Environment Agency’s surface model minus its terrain model gives the height of everything on the ground. OpenStreetMap height and storey tags are useful where they exist, but most buildings do not have them.
What scale should a 3D-printed city model be?
It depends on how much detail you want. At 1:7,500, as here, a typical house is under a millimetre tall and terraces print as continuous blocks. For individual houses with clear gaps between them, aim for 1:2,000 or larger, which means a smaller area per print or tiling the model.
Why are some buildings missing from the print?
They were narrower than 0.8 mm at print scale, or smaller than 0.8 mm² in area, and were removed so that the slicer would not drop them unpredictably. Change MIN_FEATURE_MM and MIN_AREA_MM2 to suit your printer and nozzle.
Can I use OS data instead of OpenStreetMap?
Yes. Any footprint polygons in British National Grid will work, for example OS Open Map Local buildings, published under the Open Government Licence. Replace Step 2 with a read of the file using geopandas or fiona, and keep the rest.
Next steps
- Add water and parks in other colours with Part 3, multi-colour terrain prints.
- Print a larger area across several beds with Part 5, tiling large regions.
- Look at the LiDAR behind the model in Working with LiDAR point clouds in Python, or explore it on screen with 3D terrain visualisation with PyVista.
- Start from the beginning with Part 1, from DEM to 3D-printable STL, or add a walk with Part 2, a GPX route on terrain.
Data and licences
- Environment Agency LiDAR Composite DTM and First Return DSM (1 m): © Environment Agency copyright and/or database right. Contains public sector information licensed under the Open Government Licence v3.0. Accessed through the Defra Data Services Platform WCS.
- Building footprints: © OpenStreetMap contributors, available under the Open Database Licence, downloaded through the Overpass API. A model printed from them is a produced work, so it should carry the credit “© OpenStreetMap contributors”.
- Code:
city_model.py, tested with Python 3.12.0, numpy 2.5.4, rasterio 1.5.2, shapely 2.2.0, manifold3d 3.5.5 and pyvista 0.49.2. All processing runs locally; the only network requests fetch the LiDAR tiles from the WCS and the buildings from Overpass.
Key terms
- DSM and DTM
- A digital surface model (DSM) is the height of the first thing the laser hit: roofs, trees, bridges. A digital terrain model (DTM) is the bare ground with those removed. DSM minus DTM is the height of everything standing on the ground.
- Footprint
- The outline of a building in plan, as mapped in OpenStreetMap.
- Morphological opening
- Shrinking a shape by a distance and then growing it back by the same distance. Parts narrower than twice the distance vanish; everything else returns to its original outline.
- Overpass API
- A read-only query service for OpenStreetMap data, suited to fetching every feature of one kind, such as all buildings, in an area.
Data for this tutorial
- Environment Agency LiDAR · 1 m DTM and DSM for England, Open Government Licence
- OpenStreetMap · Building footprints worldwide, Open Database Licence
Licences and formats for each source are listed in the GIS data sources catalogue.