Cloud Optimised GeoTIFFs in Python: reproject, mosaic and validate a COG
Mosaic four Copernicus DEM GLO-30 tiles straight from AWS with rasterio, reproject them to British National Grid, write a validated Cloud Optimised GeoTIFF with rio-cogeo, and measure exactly how many bytes HTTP range requests fetch.
- Level
- Intermediate
- Tested with
- Python 3.12
- Source code
- Download scripts
Key takeaways
- A Cloud Optimised GeoTIFF is an ordinary GeoTIFF with internal tiles, overviews and the header at the front. Any GDAL-based reader, including rasterio, can then fetch only the blocks it needs over HTTP.
- Reading a 5 km window from a 30.9 MB Copernicus tile on AWS took 2 range requests, 2.75 MB (8.9% of the file) and 0.24 s, against 30.9 MB and 2.04 s for downloading the file.
- rasterio.merge mosaicked four remote tiles in 10 range requests (17.86 MB, 1.6 s), and reproject() turned them into a 2000 x 2000 px, 25 m grid in British National Grid in 0.19 s.
- For a float32 DEM, the floating-point predictor matters more than the codec: DEFLATE without it made the COG bigger than the uncompressed GeoTIFF (17.07 MB against 16.02 MB); with it, 13.19 MB. Lossy LERC with a 0.1 m error bound gave 5.30 MB.
- Block size sets the cost of small reads: a 2 x 2 km window fetched 0.36 MB with 256 px blocks, 1.39 MB with 512 px and 4.92 MB with 1024 px. The 1/16 overview read cost 0.72 MB from the COG and 15.98 MB from the plain GeoTIFF.
Before you start
- Python 3.10+ with rasterio, rio-cogeo, numpy, pandas, matplotlib, pyproj and requests
- Basic rasterio: opening a file, reading a band and using a window (see the terrain analysis tutorial)
- An internet connection; the script downloads about 200 MB in total, most of it for deliberate whole-file comparisons
Short answer: to create a Cloud Optimised GeoTIFF in Python, write your raster as usual and convert it with rio-cogeo: cog_translate("in.tif", "out.tif", cog_profiles.get("deflate"), overview_resampling="average"), then check it with cog_validate("out.tif"). With rasterio alone, rasterio.shutil.copy("in.tif", "out.tif", driver="COG", COMPRESS="DEFLATE", PREDICTOR="YES", BLOCKSIZE=512) does the same through GDAL’s COG driver. To reproject and mosaic first, open the source tiles (they can be https:// URLs), combine them with rasterio.merge.merge, and warp the result with rasterio.warp.reproject.
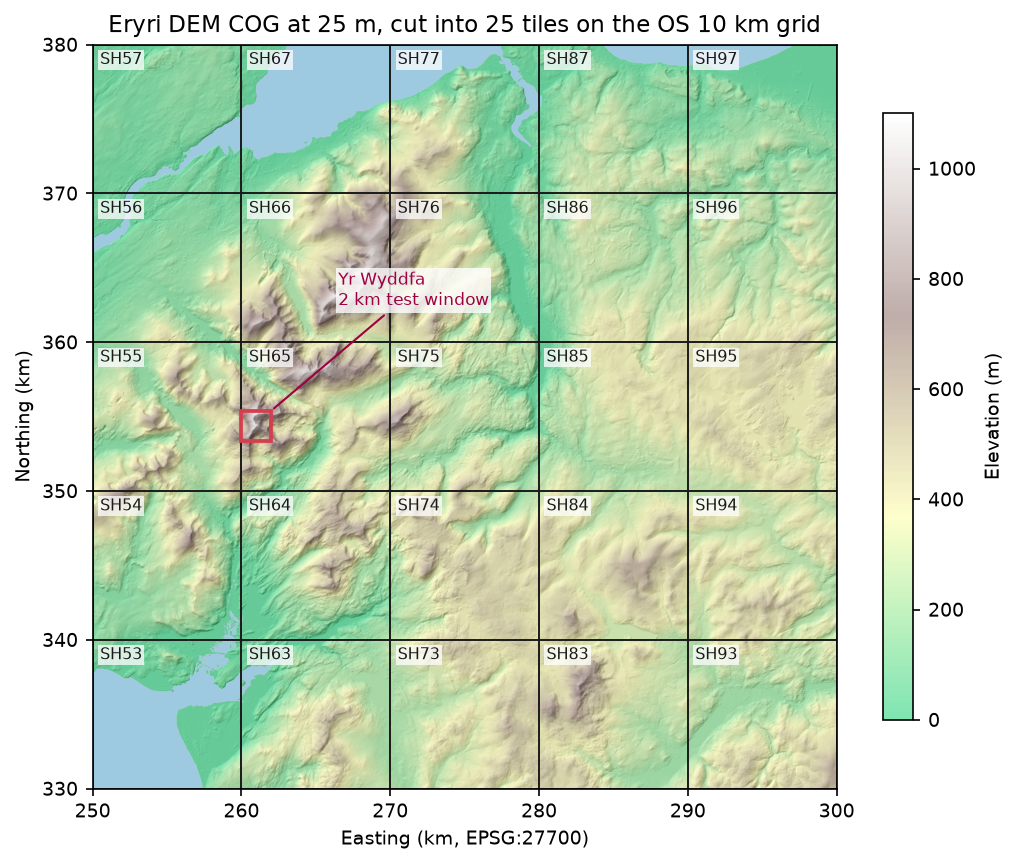
This is part 1 of the two-part series Cloud-native rasters in Python. We mosaic four Copernicus DEM tiles straight from Amazon S3, reproject them to British National Grid, and write a validated COG of Eryri (Snowdonia). Along the way we count every byte that GDAL fetches, so you can see what “cloud-native” buys you. Finally we cut the COG into 25 tiles on the Ordnance Survey 10 km grid. In part 2, those tiles become a static STAC catalogue built with pystac, which we validate, query and compare with the Earth Search and Planetary Computer STAC APIs.
You will learn how to:
- read remote COGs with rasterio, and count the HTTP range requests behind each read;
- mosaic several tiles with
rasterio.mergeand reproject them to a projected grid; - write a COG with rio-cogeo and with the GDAL COG driver, and validate it;
- see the internal tiles and overviews inside the file;
- choose the compression, predictor and block size, with measured sizes;
- serve your own COG over HTTP and measure what windowed and overview reads cost.
All outputs below are real results from cog_mosaic.py, run on 3 November 2026 on Windows 11 from the UK with Python 3.12.0, rasterio 1.5.2 (GDAL 3.12.2), rio-cogeo 7.0.4, numpy 2.5.4 and pandas 3.1.0.
Set up
pip install rasterio==1.5.2 rio-cogeo==7.0.4 numpy==2.5.4 pandas==3.1.0 matplotlib==3.11.2 pyproj==3.8.0 requests==2.34.2The rasterio wheels bundle GDAL, so you need nothing else. The Copernicus tiles sit in the public AWS bucket copernicus-dem-30m and need no account or credentials. Each 1 x 1 degree tile has a predictable URL:
TILES = ["N53_00_W005_00", "N53_00_W004_00", "N52_00_W005_00", "N52_00_W004_00"]BUCKET = "https://copernicus-dem-30m.s3.amazonaws.com"BNG = "EPSG:27700"AOI = (250_000, 330_000, 300_000, 380_000)   # 50 x 50 km of Eryri in British National Grid (OS square SH)RES = 25                                      # output pixel size in metres: 10 km = 400 pixels exactly

def tile_url(tile: str) -> str:    name = f"Copernicus_DSM_COG_10_{tile}_DEM"    return f"{BUCKET}/{name}/{name}.tif"
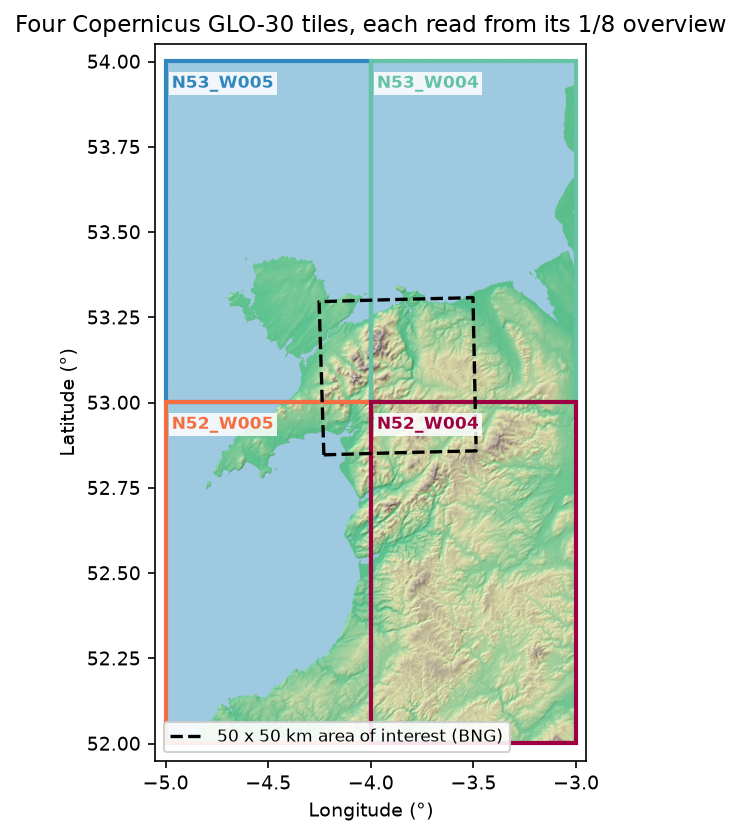
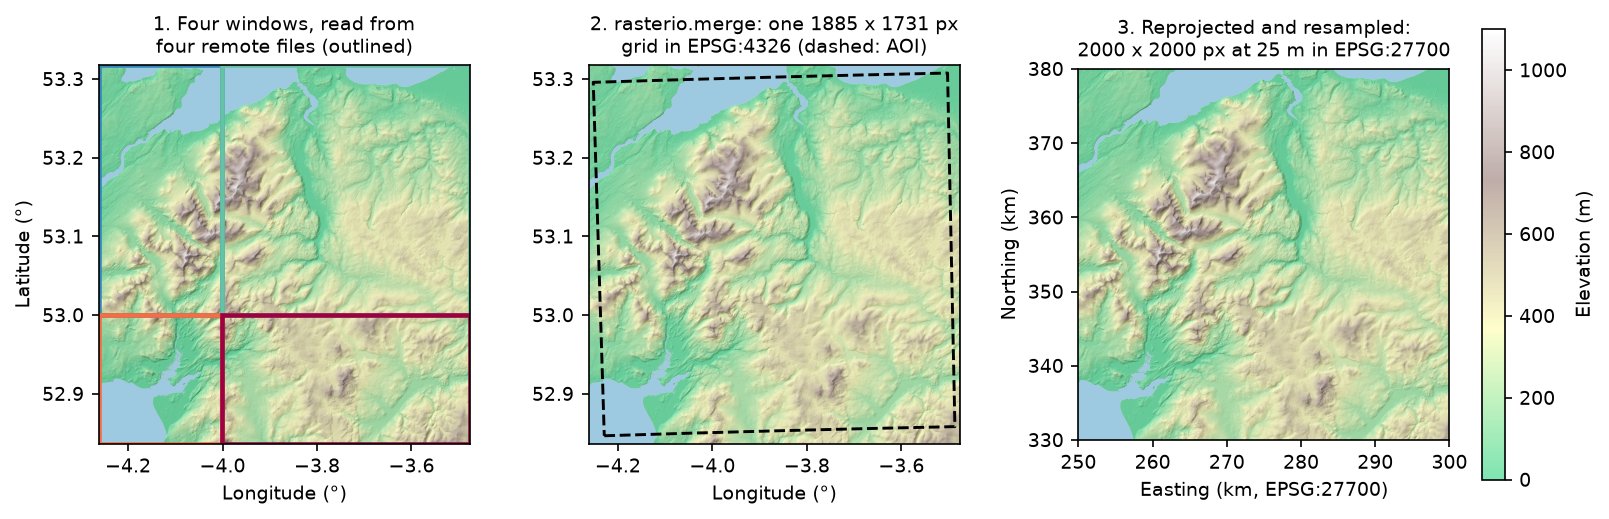
Our area of interest is the 50 x 50 km square from easting 250 km to 300 km and northing 330 km to 380 km, which covers Yr Wyddfa (Snowdon), the Glyderau, the Carneddau and the Conwy valley. In longitude and latitude it straddles the corner where four GLO-30 tiles meet.
Counting the bytes GDAL fetches
GDAL reads remote files through its /vsicurl/ layer, which turns each read into HTTP range requests. With CPL_DEBUG on, it logs every request as Downloading 0-16383 ..., and rasterio passes those messages to Python’s logging. A small handler adds them up:
RANGES: list[tuple[int, int]] = []

class RangeLog(logging.Handler):    def emit(self, record):        for a, b in re.findall(r"Downloading (\d+)-(\d+)", record.getMessage()):            RANGES.append((int(a), int(b)))

logging.getLogger("rasterio").addHandler(RangeLog())GDAL_ENV = dict(GDAL_DISABLE_READDIR_ON_OPEN="EMPTY_DIR", CPL_VSIL_CURL_ALLOWED_EXTENSIONS=".tif")
The two GDAL settings matter for any remote read. GDAL_DISABLE_READDIR_ON_OPEN="EMPTY_DIR" stops GDAL listing the “directory” on S3 to look for sidecar files, and CPL_VSIL_CURL_ALLOWED_EXTENSIONS stops it probing for .aux.xml and .ovr files that don’t exist. The script’s measured() helper switches debug logging on, runs a read inside rasterio.Env(CPL_DEBUG=True, **GDAL_ENV), and returns the median time of three runs with the request and byte counts. A unique ?run=N query string on each URL stops GDAL’s in-process cache from answering a repeat read.
Step 1: inspect the source COGs
Opening a COG reads only its header, so we can inspect all four tiles and read a 1/8-resolution preview of each from its overviews:
with rasterio.open(url) as src: print(src.width, src.height, src.block_shapes, src.overviews(1), src.compression, src.nodata) arr = src.read(1, out_shape=(src.height // 8, src.width // 8)) # served from the 1/8 overview tile size_px blocks overviews compress predictor file_MB thumb_requests thumb_MBN53_00_W005_00 2400 x 3600 1024x1024 [2, 4, 8] DEFLATE 3 5.8 2 0.10N53_00_W004_00 2400 x 3600 1024x1024 [2, 4, 8] DEFLATE 3 11.4 2 0.18N52_00_W005_00 2400 x 3600 1024x1024 [2, 4, 8] DEFLATE 3 10.1 2 0.16N52_00_W004_00 2400 x 3600 1024x1024 [2, 4, 8] DEFLATE 3 30.9 2 0.43crs: EPSG:4326 | pixel size (deg): (0.0004167, 0.0002778) | nodata: NoneAOI in BNG: (250000, 330000, 300000, 380000) -> lon/lat bounds: (-4.2521, 52.8466, -3.4867, 53.3075)Each tile is already a COG: 1024 px blocks, overviews at 1/2, 1/4 and 1/8, DEFLATE with the floating-point predictor. Each preview cost two requests and 0.10–0.43 MB, between 1.4% and 1.7% of each file. Above 50° N, GLO-30 tiles are 2400 pixels wide, not 3600: the longitude spacing widens to 1.5 arc-seconds so that pixels stay roughly square on the ground. The tile sizes vary sixfold because sea compresses to almost nothing, while the hills of N52_W004 do not.
Step 2: a windowed read against the whole file
The largest tile, N52_W004, holds Arenig Fawr and the hills around Bala. We read a 5 km window at full resolution, the whole tile through rasterio, and the whole file with requests.get, three times each:
def window_read(): with rasterio.open(fresh(big)) as src: return src.read(1, window=from_bounds(*win_ll, transform=src.transform))tile N52_00_W004_00: 30.9 MB on S3 (eu-central-1); median of 3 runs job pixels requests MB pct_of_file seconds open: header only - 1 0.016 0.053 0.086 5 km window, full resolution 192 x 180 2 2.753 8.909 0.241 whole tile via rasterio 2400 x 3600 4 22.820 73.857 1.543download whole file (requests.get) - 1 30.897 100.000 2.039- Opening is one 16 kB request. GDAL reads the first 16 kB, which holds the header and the offsets of every block, and stops.
- The window cost 8.9% of the file. The 192 x 180 px window sits inside one 1024 px block, so GDAL fetched just that block’s compressed bytes: 2.75 MB in one extra request.
- Even the whole tile at full resolution skipped 26% of the file. Those bytes are the overviews, which a full-resolution read never needs. GDAL also merges neighbouring blocks into a few large requests, so the whole tile took four requests, not 12.
Step 7 below repeats this on our own files, and Figure 5 charts both.
Step 3: mosaic and reproject
rasterio.merge.merge accepts a list of paths or URLs and a target bounding box, and reads only the windows that it needs from each source:
from rasterio.merge import mergefrom rasterio.warp import reproject
pad = 0.01read_bounds = (aoi_ll[0] - pad, aoi_ll[1] - pad, aoi_ll[2] + pad, aoi_ll[3] + pad)mosaic_ll, ll_transform = merge([tile_url(t) for t in TILES], bounds=read_bounds, resampling=Resampling.nearest)mosaic_ll = mosaic_ll[0]
width = height = int((AOI[2] - AOI[0]) / RES)dst_transform = from_origin(AOI[0], AOI[3], RES, RES)dem = np.full((height, width), np.nan, dtype="float32")reproject(mosaic_ll, dem, src_transform=ll_transform, src_crs="EPSG:4326", dst_transform=dst_transform,          dst_crs=BNG, resampling=Resampling.bilinear, dst_nodata=np.nan)
rasterio.merge: 1885 x 1731 px in EPSG:4326 from 4 remote tiles, 10 range requests, 17.86 MB, 1.6 s N53_00_W005_00: window 629 x 1142 px N53_00_W004_00: window 1257 x 1142 px N52_00_W005_00: window 629 x 589 px N52_00_W004_00: window 1257 x 589 pxreprojected to EPSG:27700 at 25 m: 2000 x 2000 px in 0.19 s; NaN pixels: 0elevation min/mean/max (m): -1.7 / 264.6 / 1071.8; sea and lakes at 0 m or below: 6.2%The four tiles hold 58.2 MB between them; the mosaic needed 17.86 MB. We pad the bounding box by 0.01° (about 700 m) so that the reprojected square never runs off the edge of the mosaic; the zero NaN count confirms it. We use nearest resampling to merge, because the tiles share one grid and no values need to change. We use bilinear to reproject, because the British National Grid pixels don’t line up with the source pixels.
Step 4: write the COG, and compare the options
First we write the DEM as a plain GeoTIFF with GDAL’s defaults, then convert it with rio-cogeo:
from rio_cogeo.cogeo import cog_translate, cog_validatefrom rio_cogeo.profiles import cog_profiles
with rasterio.open("eryri_dem_25m_plain.tif", "w", driver="GTiff", dtype="float32", count=1, width=width,                   height=height, crs=BNG, transform=dst_transform) as dst:    dst.write(dem, 1)
cog_profile = cog_profiles.get("deflate")cog_profile.update(predictor=3, blockxsize=512, blockysize=512)cog_translate("eryri_dem_25m_plain.tif", "eryri_dem_25m_cog.tif", cog_profile, overview_resampling="average",              additional_cog_metadata={"SOURCE": "Copernicus DEM GLO-30 (AWS copernicus-dem-30m), 4 tiles"})print(cog_validate("eryri_dem_25m_cog.tif"))
plain GeoTIFF (GDAL defaults): 16.02 MB, valid COG: Falserio-cogeo COG: 13.19 MB in 0.85 s; valid COG: True; errors: []; warnings: []cog_validate returns a tuple of (is_valid, errors, warnings). The plain GeoTIFF fails because GDAL writes uncompressed strips by default, with no overviews. Use average resampling for the overviews of continuous data such as elevation; the default, nearest, picks one pixel in each block and makes the overviews noisy.
GDAL 3.1 and later also has a dedicated COG driver, which you can call through rasterio.shutil.copy. We used it to write six variants of the same DEM:
rasterio.shutil.copy("eryri_dem_25m_plain.tif", "eryri_dem_25m_zstd.tif", driver="COG", BLOCKSIZE=512, COMPRESS="ZSTD", PREDICTOR="YES", OVERVIEW_RESAMPLING="AVERAGE") variant block MB write_s valid overviews max_abs_error_m DEFLATE, no predictor 512 17.070 0.844 True [2, 4] 0.0 DEFLATE + predictor 512 13.194 0.776 True [2, 4] 0.0 ZSTD + predictor 512 12.907 0.585 True [2, 4] 0.0LERC_ZSTD, max error 0.1 m 512 5.299 0.277 True [2, 4] 0.1 DEFLATE + predictor 256 13.383 0.814 True [2, 4, 8] 0.0 DEFLATE + predictor 1024 12.496 0.702 True [2] 0.0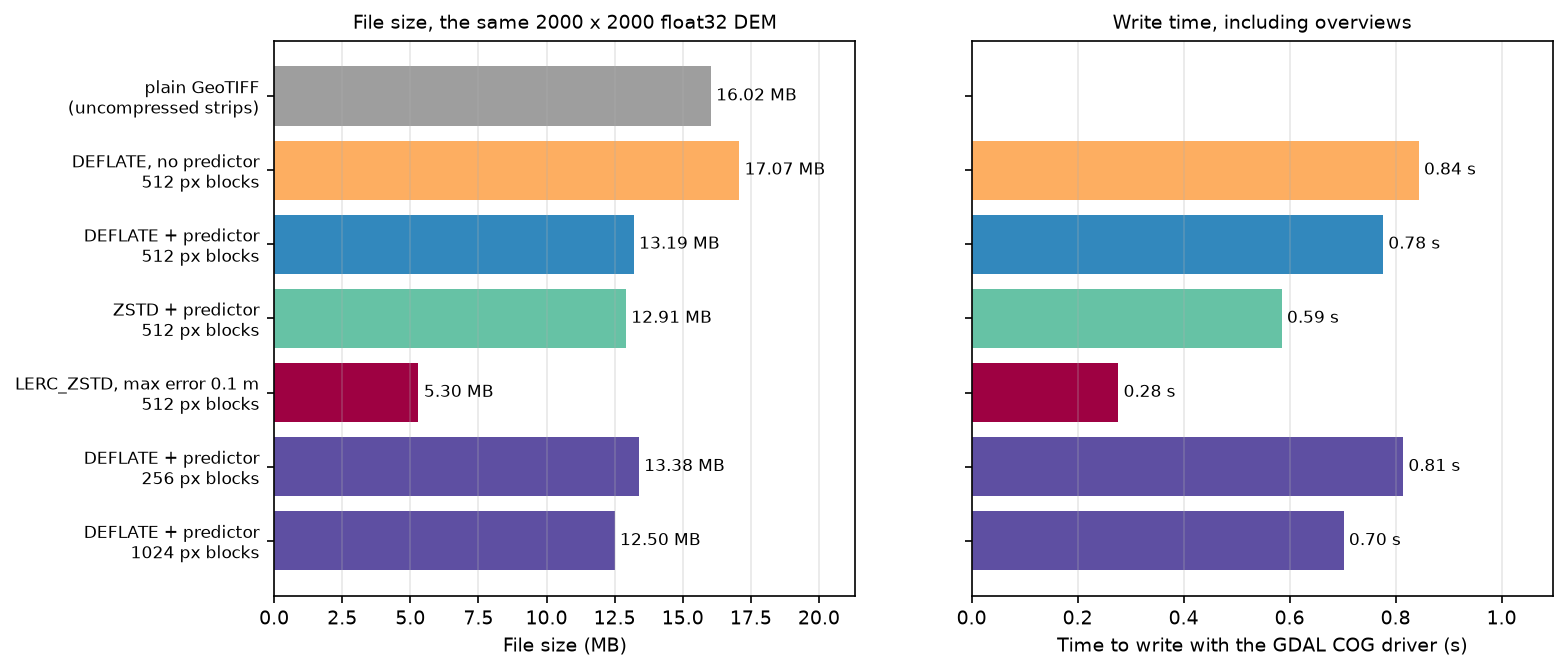
What the numbers show:
- Use the predictor for float data. The raw bytes of float32 elevations look almost random to DEFLATE.
PREDICTOR=YES(which the COG driver turns into the floating-point predictor, 3, for float data) stores differences between neighbours instead, and saved 23%. - ZSTD is slightly smaller and faster than DEFLATE, but older GDAL builds (before 2.3) and some non-GDAL readers can’t decode it. DEFLATE is the safe default for files you publish.
- LERC is lossy, and honest about it.
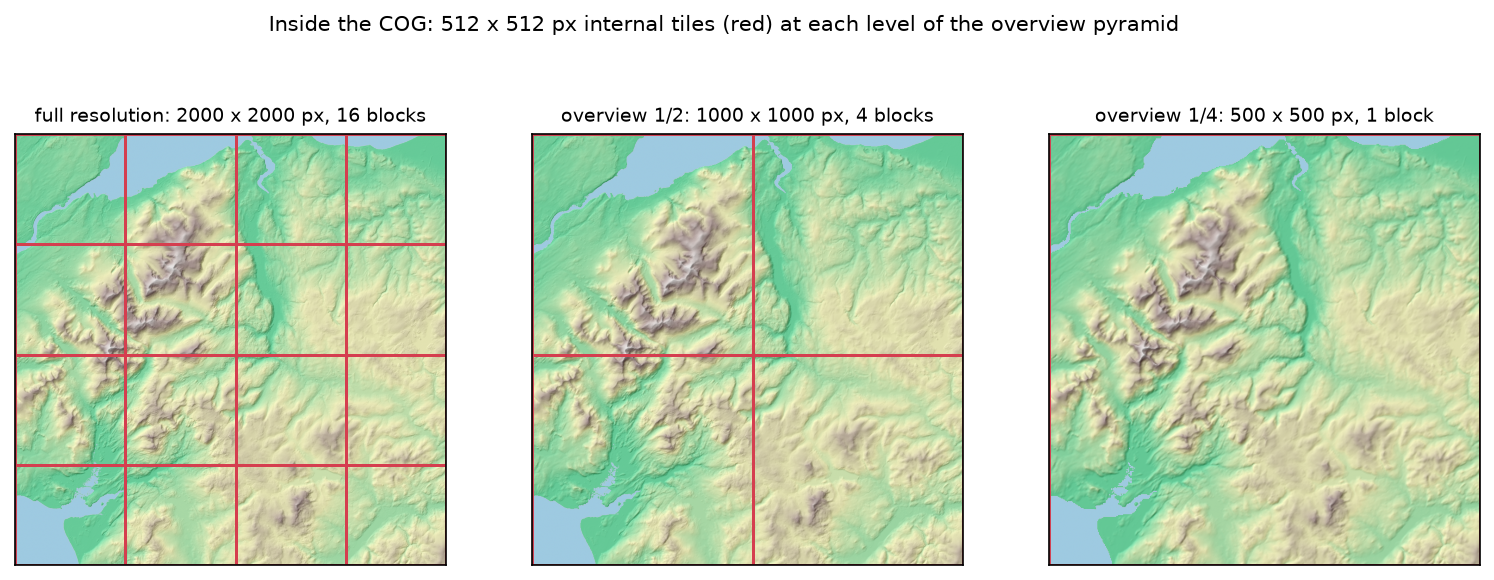
MAX_Z_ERROR=0.1guarantees every pixel within 0.1 m of the original, which the script confirms. For a 30 m DSM whose own vertical accuracy is metres, that loss is negligible, and the file is 60% smaller. - The block size sets the number of overviews. The COG driver adds overviews until the smallest one fits in a single block: 2000 → 1000 → 500 px with 512 px blocks, one level fewer with 1024 px, one more with 256 px. Step 7 shows why that matters.
Step 5: look inside the COG
cog_info lists every image file directory (IFD), with its size and block shape:
from rio_cogeo.cogeo import cog_info
info = cog_info("eryri_dem_25m_cog.tif")for ifd in info.IFD:    print(ifd.Level, ifd.Width, ifd.Height, ifd.Blocksize, ifd.Decimation)
compression: DEFLATE | COG layout: COG | predictor: 3 IFD level 0: 2000 x 2000 px, blocks 512 x 512, decimation 0 IFD level 1: 1000 x 1000 px, blocks 512 x 512, decimation 2 IFD level 2: 500 x 500 px, blocks 512 x 512, decimation 4The LAYOUT=COG tag tells readers that the file follows the COG layout: all IFDs at the front, then the overview blocks from smallest to largest, then the full-resolution blocks. A reader that only wants a preview finds the small overview near the start of the file.
Step 6: cut 25 COG tiles on the OS 10 km grid
Part 2 needs a set of files to catalogue, so we cut the COG into the 25 Ordnance Survey 10 km squares it covers. A 10 km square is 400 pixels, so each window lines up exactly:
with rasterio.open("eryri_dem_25m_cog.tif") as src: for e in range(AOI[0], AOI[2], 10_000): for n in range(AOI[1], AOI[3], 10_000): name = f"SH{(e % 100_000) // 10_000}{(n % 100_000) // 10_000}" # e.g. SH65 contains Yr Wyddfa w = from_bounds(e, n, e + 10_000, n + 10_000, transform=src.transform).round_offsets().round_lengths() arr = src.read(1, window=w) # write arr to a temporary GeoTIFF, then: rasterio.shutil.copy(tmp, TILE_DIR / f"{name}.tif", driver="COG", BLOCKSIZE=256, COMPRESS="DEFLATE", PREDICTOR="YES", OVERVIEW_RESAMPLING="AVERAGE")25 tiles of 400 x 400 px, all valid COGs: True, total 12.72 MBtile valid kB min_m max_mSH65 True 537.8 53.6 1071.8SH66 True 521.6 33.0 1059.2SH76 True 549.8 1.0 875.1SH75 True 546.4 8.2 865.0SH83 True 508.7 158.5 846.5For 400 px tiles, 256 px blocks keep the internal tiling useful; with 512 px blocks, each tile would be a single block. The two letters and two digits are the standard OS grid reference: SH65 is the square whose south-west corner is at easting 260 km and northing 350 km, and it contains Yr Wyddfa.
Step 7: range reads from our own files
To measure our own files, the script serves its output/ folder on localhost with a 30-line subclass of http.server.SimpleHTTPRequestHandler. Python’s built-in server ignores Range headers, so the subclass answers them with 206 Partial Content and records the bytes it sends. We then read three things from four files: a 2 x 2 km window around Yr Wyddfa, the whole area at 1/16 resolution, and the whole file.
with rasterio.Env(**GDAL_ENV), rasterio.open(f"/vsicurl/{base}/{path.name}") as s: win = s.read(1, window=from_bounds(*snow_win, transform=s.transform)) # 2 x 2 km ovr = s.read(1, out_shape=(s.height // 16, s.width // 16)) # 1/16 resolution file job pixels requests MB pct_of_file ms plain GeoTIFF 2 x 2 km window at Yr Wyddfa 80 x 80 4 0.689 4.302 12.000 plain GeoTIFF whole area at 1/16 resolution 125 x 125 5 15.976 99.693 1085.806 plain GeoTIFF whole file, full resolution 2000 x 2000 5 16.025 100.000 1006.250 COG 512 px blocks 2 x 2 km window at Yr Wyddfa 80 x 80 3 1.393 10.555 18.332 COG 512 px blocks whole area at 1/16 resolution 125 x 125 2 0.721 5.464 12.887 COG 512 px blocks whole file, full resolution 2000 x 2000 2 9.868 74.793 866.849 COG 256 px blocks 2 x 2 km window at Yr Wyddfa 80 x 80 3 0.359 2.681 10.762 COG 256 px blocks whole area at 1/16 resolution 125 x 125 2 0.197 1.469 8.490 COG 256 px blocks whole file, full resolution 2000 x 2000 2 9.860 73.678 812.067COG 1024 px blocks 2 x 2 km window at Yr Wyddfa 80 x 80 3 4.922 39.385 128.039COG 1024 px blocks whole area at 1/16 resolution 125 x 125 2 2.654 21.240 88.044COG 1024 px blocks whole file, full resolution 2000 x 2000 2 9.875 79.022 810.774highest pixel within 1 km of Yr Wyddfa: 1071.8 m (published summit height 1,085 m)highest native GLO-30 pixel in the same area: 1074.5 m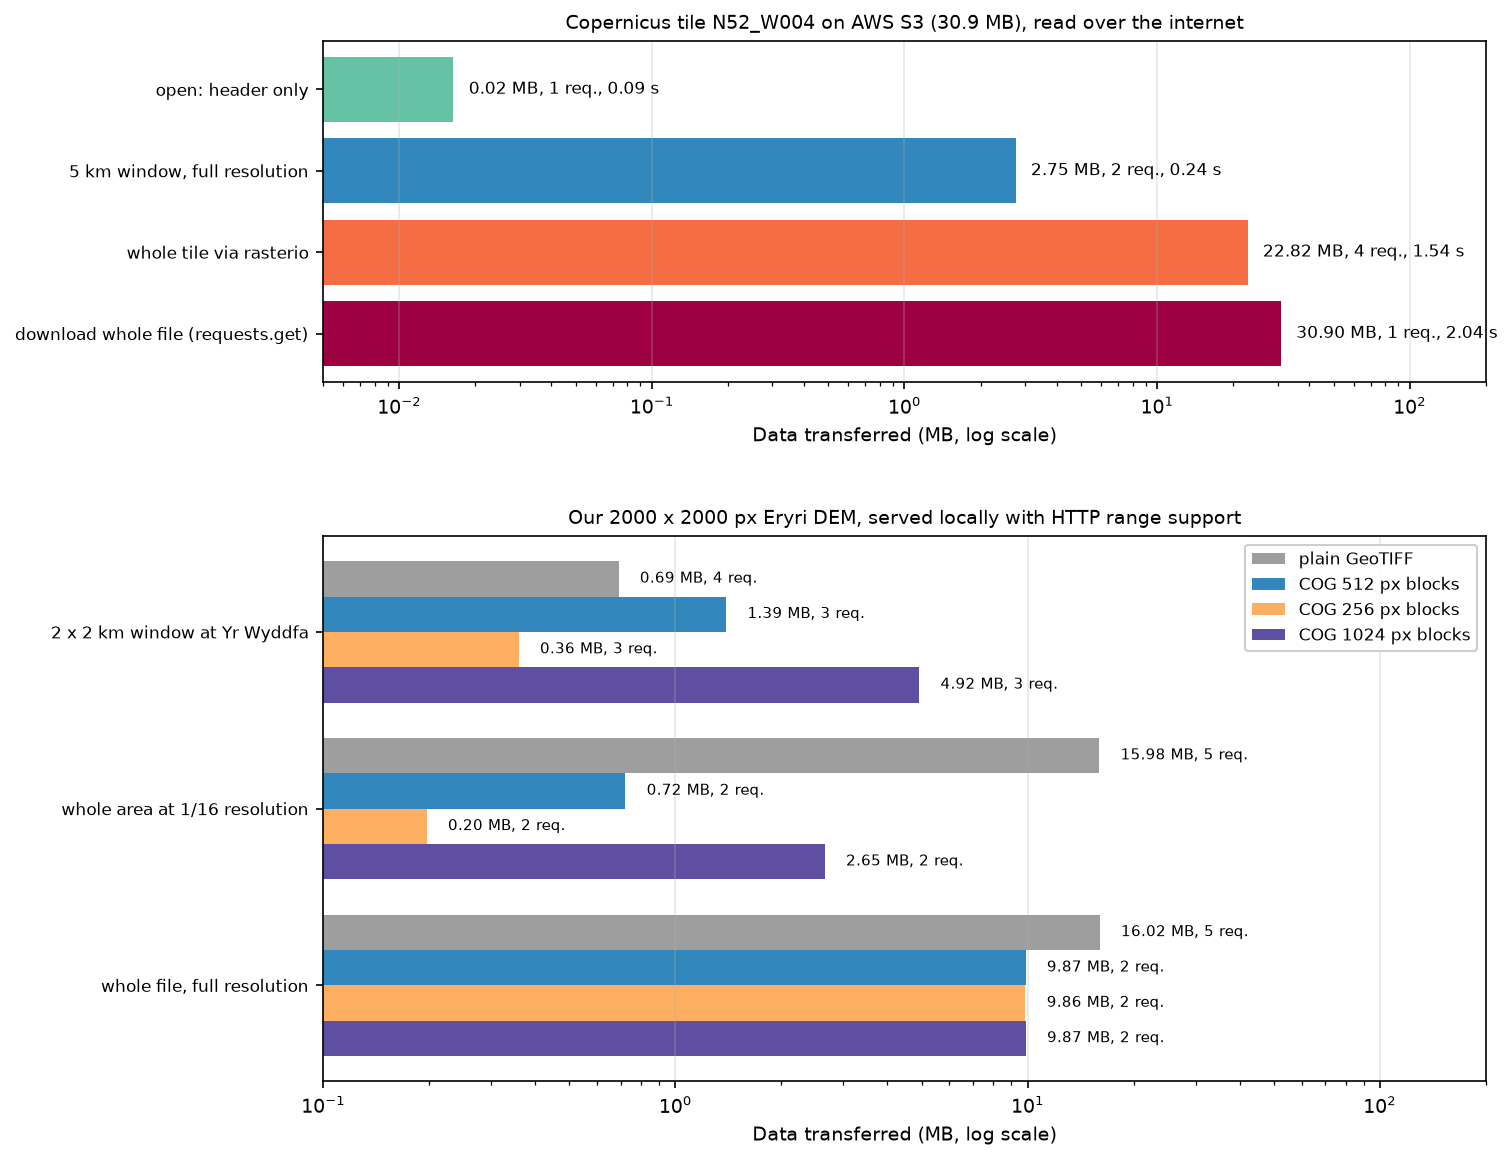
- Overviews are the big win. The plain GeoTIFF had to send 99.7% of itself for a 125 x 125 px preview, because GDAL had to read every pixel to average them. The 512 px COG sent 0.72 MB from its 1/4 overview.
- Small blocks favour small windows. The 80 x 80 px window crosses a block boundary, so it needed two blocks: 0.36 MB with 256 px blocks, 1.39 MB with 512 px and 4.92 MB with 1024 px. Larger blocks compress slightly better (Step 4) and need fewer requests for big reads. 512 px is a balanced default; choose 256 px when users mostly zoom in on small areas.
- The plain GeoTIFF won the small window. Its uncompressed strips are full-width rows, and 80 rows of 2000 float32 pixels are only 0.64 MB. That advantage disappears as soon as the data is compressed or you want a preview.
- Whole-file reads skip the overviews. Every COG read 74–79% of itself for the full-resolution grid.
The localhost timings show the CPU cost of decompressing, not network latency. Over the internet, as in Step 2, each request also costs a round trip, which is why GDAL merges neighbouring blocks into one request.
The summit check is a useful sanity test. The highest pixel near Yr Wyddfa is 1071.8 m, against the published 1,085 m. The native GLO-30 pixels reach 1074.5 m: a 30 m pixel averages the summit with the slopes around it, and bilinear resampling to 25 m smooths it a little further.
Limitations and caveats
- GLO-30 is a surface model. It includes trees and buildings, and its heights refer to the EGM2008 geoid, not Ordnance Datum Newlyn, the datum of Ordnance Survey heights. Check the offset before you compare it with OS spot heights or surveys.
- No nodata value. The tiles have no nodata, and the sea is stored as 0 m or just below (6.2% of our grid). To mask the sea reliably, use a coastline polygon rather than an elevation threshold.
- Timings vary. Step 2 used one home connection to the
eu-central-1region; Step 7 used localhost. Byte and request counts are the reliable figures, and they were identical across repeated runs. - GDAL’s request merging changes with settings.
GDAL_HTTP_MERGE_CONSECUTIVE_RANGESandCPL_VSIL_CURL_CHUNK_SIZE(16 kB by default) change how reads are split. Our counts use GDAL 3.12.2 defaults. - COG is a layout, not a guarantee. A valid COG with huge blocks or no overviews still reads badly. Always check block size and overviews, as
cog_infoshows.
Frequently asked questions
How do I create a Cloud Optimized GeoTIFF in Python?
Use rio-cogeo: cog_translate(src_path, dst_path, cog_profiles.get("deflate"), overview_resampling="average"), then cog_validate(dst_path). Or use rasterio with GDAL’s COG driver: rasterio.shutil.copy(src_path, dst_path, driver="COG", COMPRESS="DEFLATE", PREDICTOR="YES"). Both write internal tiles, overviews and the COG layout in one step. The command-line equivalent is gdal_translate in.tif out.tif -of COG -co COMPRESS=DEFLATE -co PREDICTOR=YES.
How do I reproject and mosaic rasters with rasterio?
Pass the files or URLs to rasterio.merge.merge(paths, bounds=...) to get one array and its transform, then call rasterio.warp.reproject with the source and destination transforms and CRSs. Pad the bounds slightly so that the reprojected grid stays inside the mosaic. For large areas, rasterio.vrt.WarpedVRT or a GDAL VRT avoids holding the whole mosaic in memory.
What is the difference between a GeoTIFF and a COG?
A COG is a GeoTIFF with a specific internal layout: tiled rather than striped, with overviews, and with all the metadata at the front of the file. Any GeoTIFF reader can open it. Readers that understand HTTP range requests can also fetch just the parts they need, which here cut a preview read from 15.98 MB to 0.72 MB.
What block size and compression should I use for a COG?
For most rasters, use 512 px blocks with DEFLATE, plus PREDICTOR=YES for float data or PREDICTOR=2 for integers. Use 256 px blocks if people mostly read small windows, and ZSTD if every reader you care about runs GDAL 2.3 or later. For elevation where a known error bound is acceptable, LERC gave a file 60% smaller.
Can I read a COG from S3 without downloading it?
Yes. Pass the https:// URL (or s3:// with credentials) to rasterio.open and read a window. Rasterio uses GDAL’s /vsicurl/ layer, which fetches only the byte ranges it needs. Here a 5 km window from a 30.9 MB tile cost 2.75 MB and a quarter of a second.
Next steps
- Continue with part 2: build a STAC catalogue with pystac, which catalogues these 25 tiles, validates the catalogue, and compares it with the Earth Search and Planetary Computer STAC APIs.
- Compute slope, aspect and hillshade from this DEM in Raster terrain analysis with rasterio.
- Learn more about British National Grid and reprojection in Coordinate reference systems in Python.
- Use the COG for a viewshed analysis from Yr Wyddfa, or delineate the Conwy catchment.
- Print the mountain: DEM to STL in Python turns a tile into a 3D model.
- Turn classified rasters into polygons in Raster to vector in Python.
Data and licences
- Copernicus DEM GLO-30, tiles N52–N53, W004–W005, read from the AWS Open Data bucket
copernicus-dem-30m. © DLR e.V. 2010–2014 and © Airbus Defence and Space GmbH 2014–2018, provided under COPERNICUS by the European Union and ESA; all rights reserved. GLO-30 is free to use, including commercially, under the Copernicus DEM licence; credit it as above. - Code:
cog_mosaic.py, tested with Python 3.12.0, rasterio 1.5.2 (GDAL 3.12.2), rio-cogeo 7.0.4, numpy 2.5.4, pandas 3.1.0, matplotlib 3.11.2, pyproj 3.8.0 and requests 2.34.2. Pinned versions are inrequirements.txt.
Key terms
- Cloud Optimised GeoTIFF (COG)
- A GeoTIFF laid out for reading over HTTP: tiled, with overviews, and with all the image file directories (IFDs) at the start of the file. An OGC standard since 2023 (OGC 21-026), under its official name Cloud Optimized GeoTIFF.
- HTTP Range request
- A request for part of a file, such as Range: bytes=0-16383. Servers that support it answer 206 Partial Content. Object stores such as Amazon S3 support it, which is what lets GDAL read a window from a remote COG.
- Internal tiling
- Storing a raster as square blocks (for example 512 x 512 pixels), each compressed separately, instead of as full-width strips. A reader then fetches only the blocks that a window touches.
- Overview
- A reduced-resolution copy of the raster stored in the same file, usually at 1/2, 1/4, 1/8 and so on. GDAL uses the closest overview automatically when you read at a lower resolution.
- Predictor
- A filter applied before compression that stores differences between neighbouring pixels rather than the values themselves. PREDICTOR=3 is the floating-point predictor, and it makes smooth float32 elevation data far more compressible.
- Copernicus DEM GLO-30
- A global digital surface model at 1 arc-second (about 30 m) from the TanDEM-X mission, distributed by ESA in 1 x 1 degree COG tiles, including on AWS Open Data.
Data for this tutorial
- Copernicus DEM GLO-30 · Four 1 x 1 degree COG tiles read anonymously from the AWS Open Data bucket copernicus-dem-30m
- Copernicus DEM on AWS Open Data · Bucket layout, tile naming and licence
- GDAL COG driver · Creation options such as BLOCKSIZE, COMPRESS, PREDICTOR and OVERVIEW_RESAMPLING
Licences and formats for each source are listed in the GIS data sources catalogue.